Better Code Rendering Through Virtualization
TL;DR: we rebuilt Codecov’s code renderer from the ground up utilizing virtual lists and some other nifty tricks to significantly decrease render blocking time, and unblock customers with files containing tens of thousands of lines.
The Problem

We had Jake an engineer at Microsoft working on TypeScript tooling, reach out to us, letting us know he was devastated with the code renderer crashing on them while trying to render TypeScript’s checker.ts file. The problem turns out to be that the current code renderer was not built to handle files that contains this amount of code and coverage data, leading the application to crash. The objective of our initiative is to rebuild our code renderer from the ground up utilizing new techniques so that we’re able to handle these larger files with ease. We will have to figure out how to carry over features of the current code renderer such as native search, scrolling to line, and highlighting line by line coverage.
Reproducing the Issue
The first step in any debugging scenario was to reproduce the issue that the user was running into. This was fairly simple to do once we found the correct repo and file. You can see below, once we navigate to this file the page starts to load and load and load and finally the tab crashes:
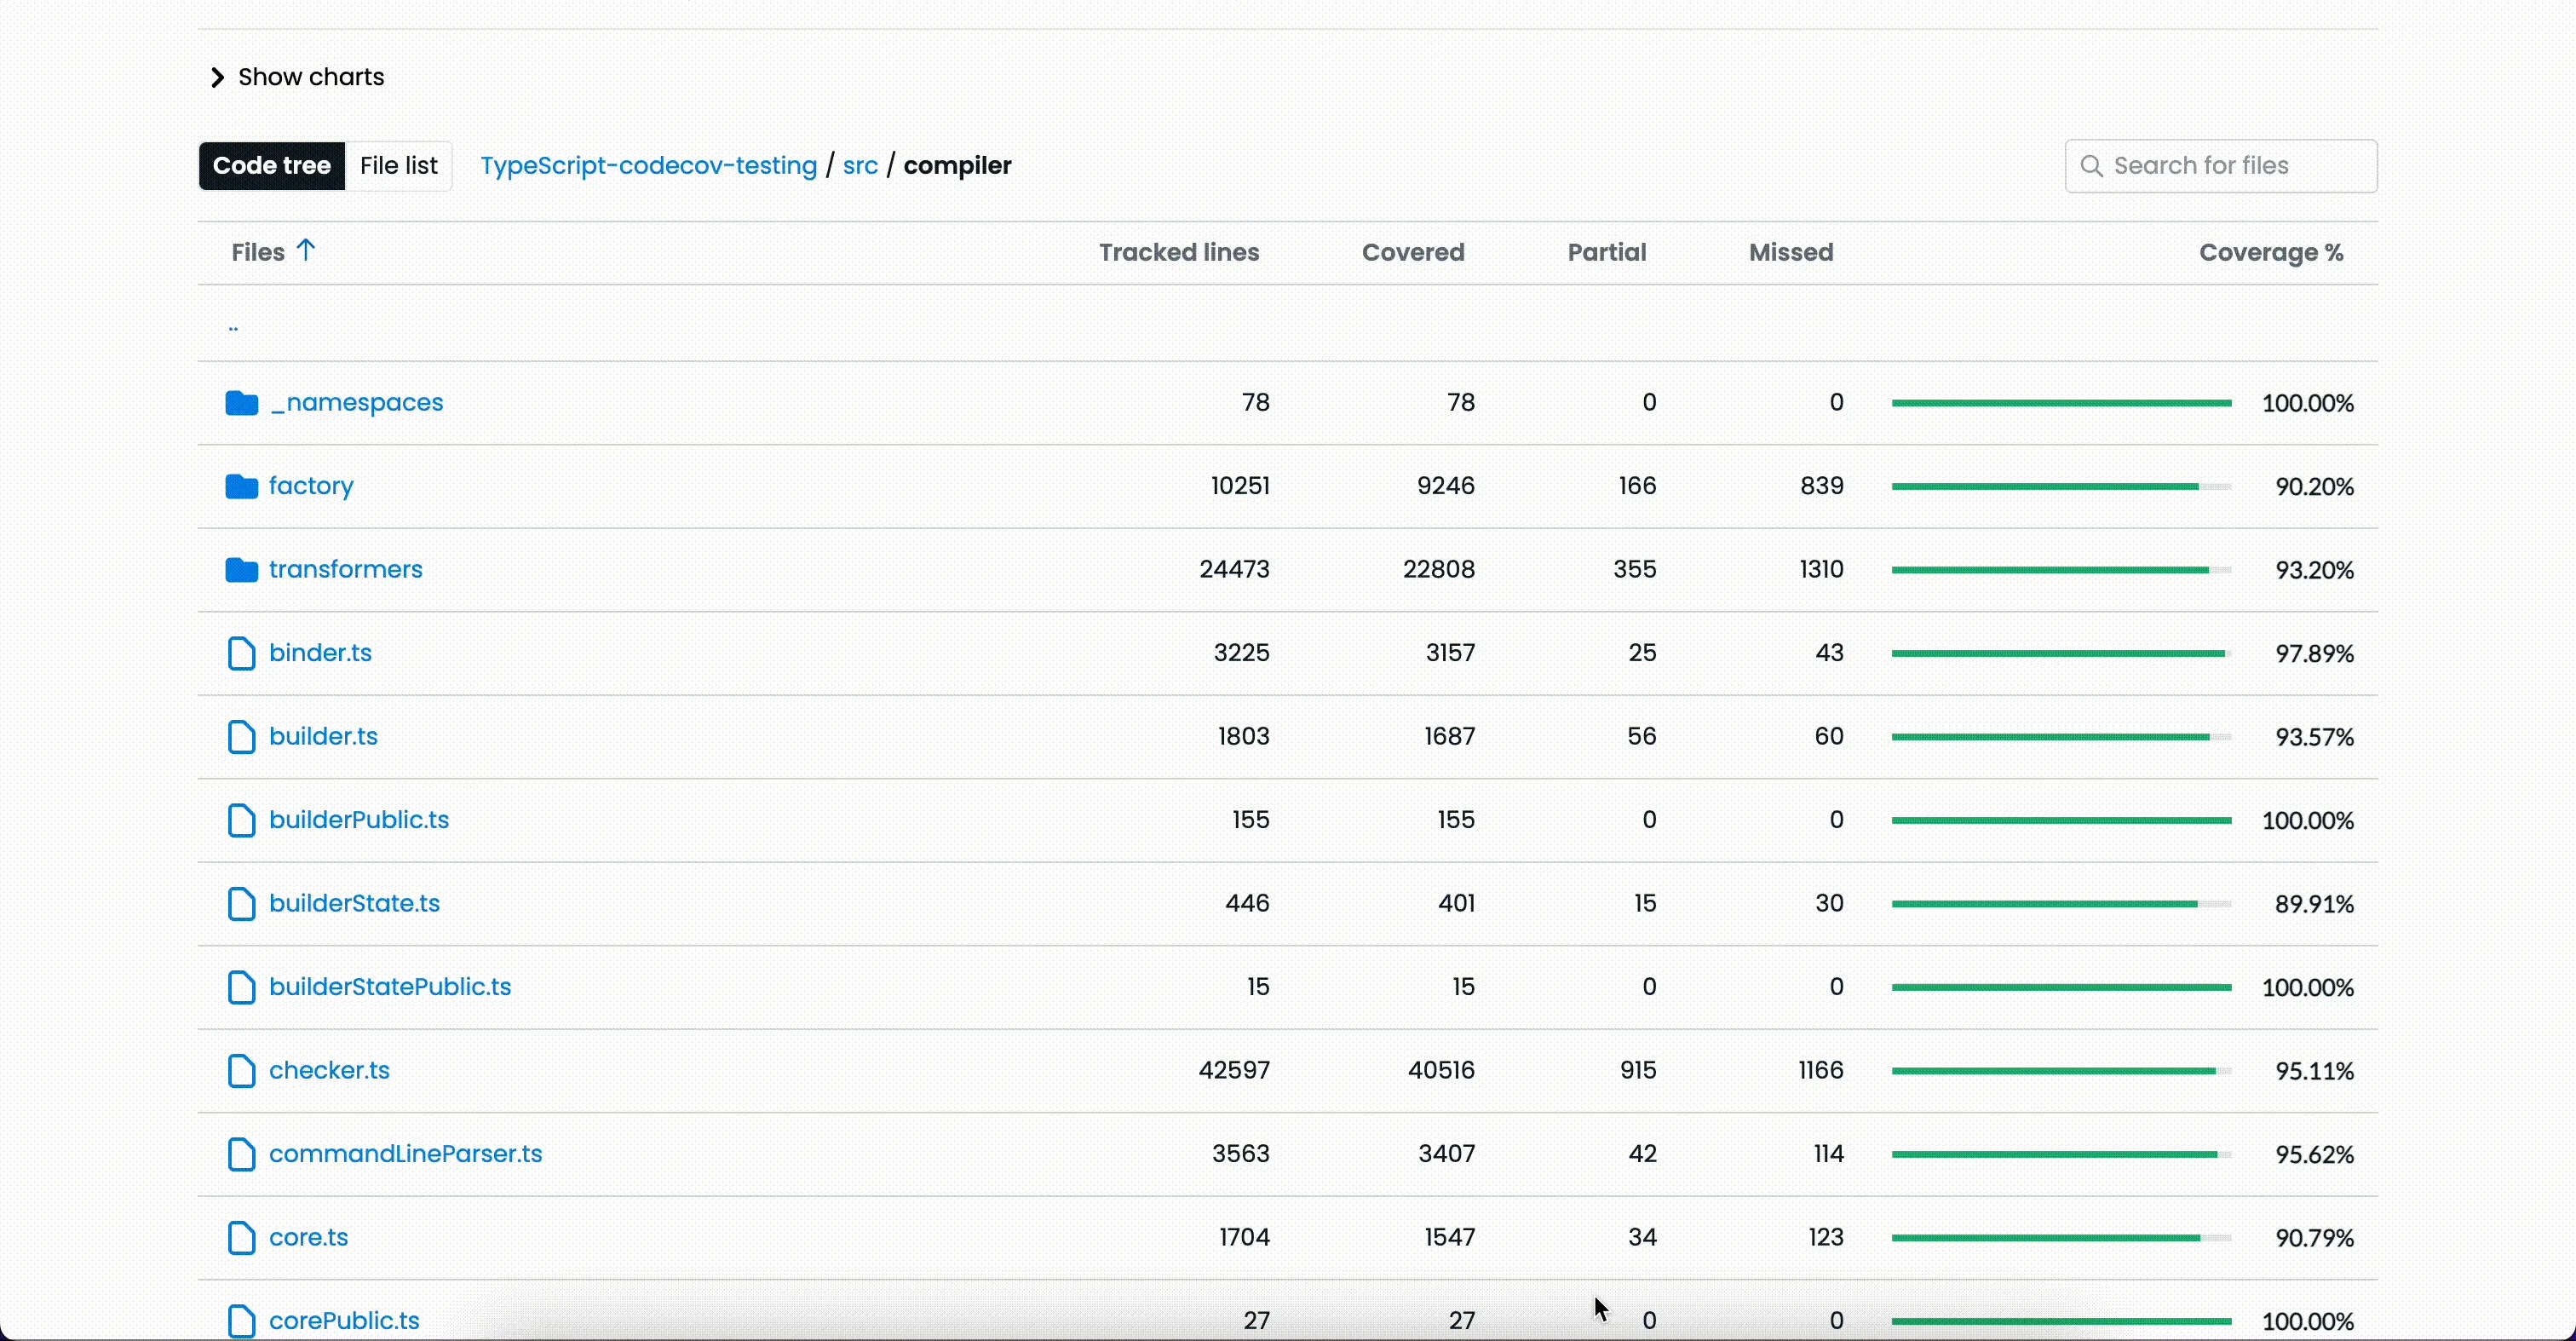
Clearly there’s something going on here. If the app is unable to render the file, we should show a message to the user rather than the page becoming unresponsive, and ideally we should be able to render any file. So let’s dive a bit deeper into understanding what is going on.
Understanding the Root Cause
For debugging purposes, we’re going to use a large file that we know won’t crash the browser while rendering so we can understand everything going on. For this example, we’re going to use a large test file from Codecov’s worker test suite, which you can view here.
There are two things we are looking for to understand where the performance bottleneck is coming from. Is it our highlighting/tokenization package, or is it React struggling to render a lot of elements? We can utilize the browser dev tools to see what/where/and how things are getting called, we use this information to narrow down where our problem is. Let’s first take a peek at the high level overview of what’s going on while we’re rendering the code renderer:
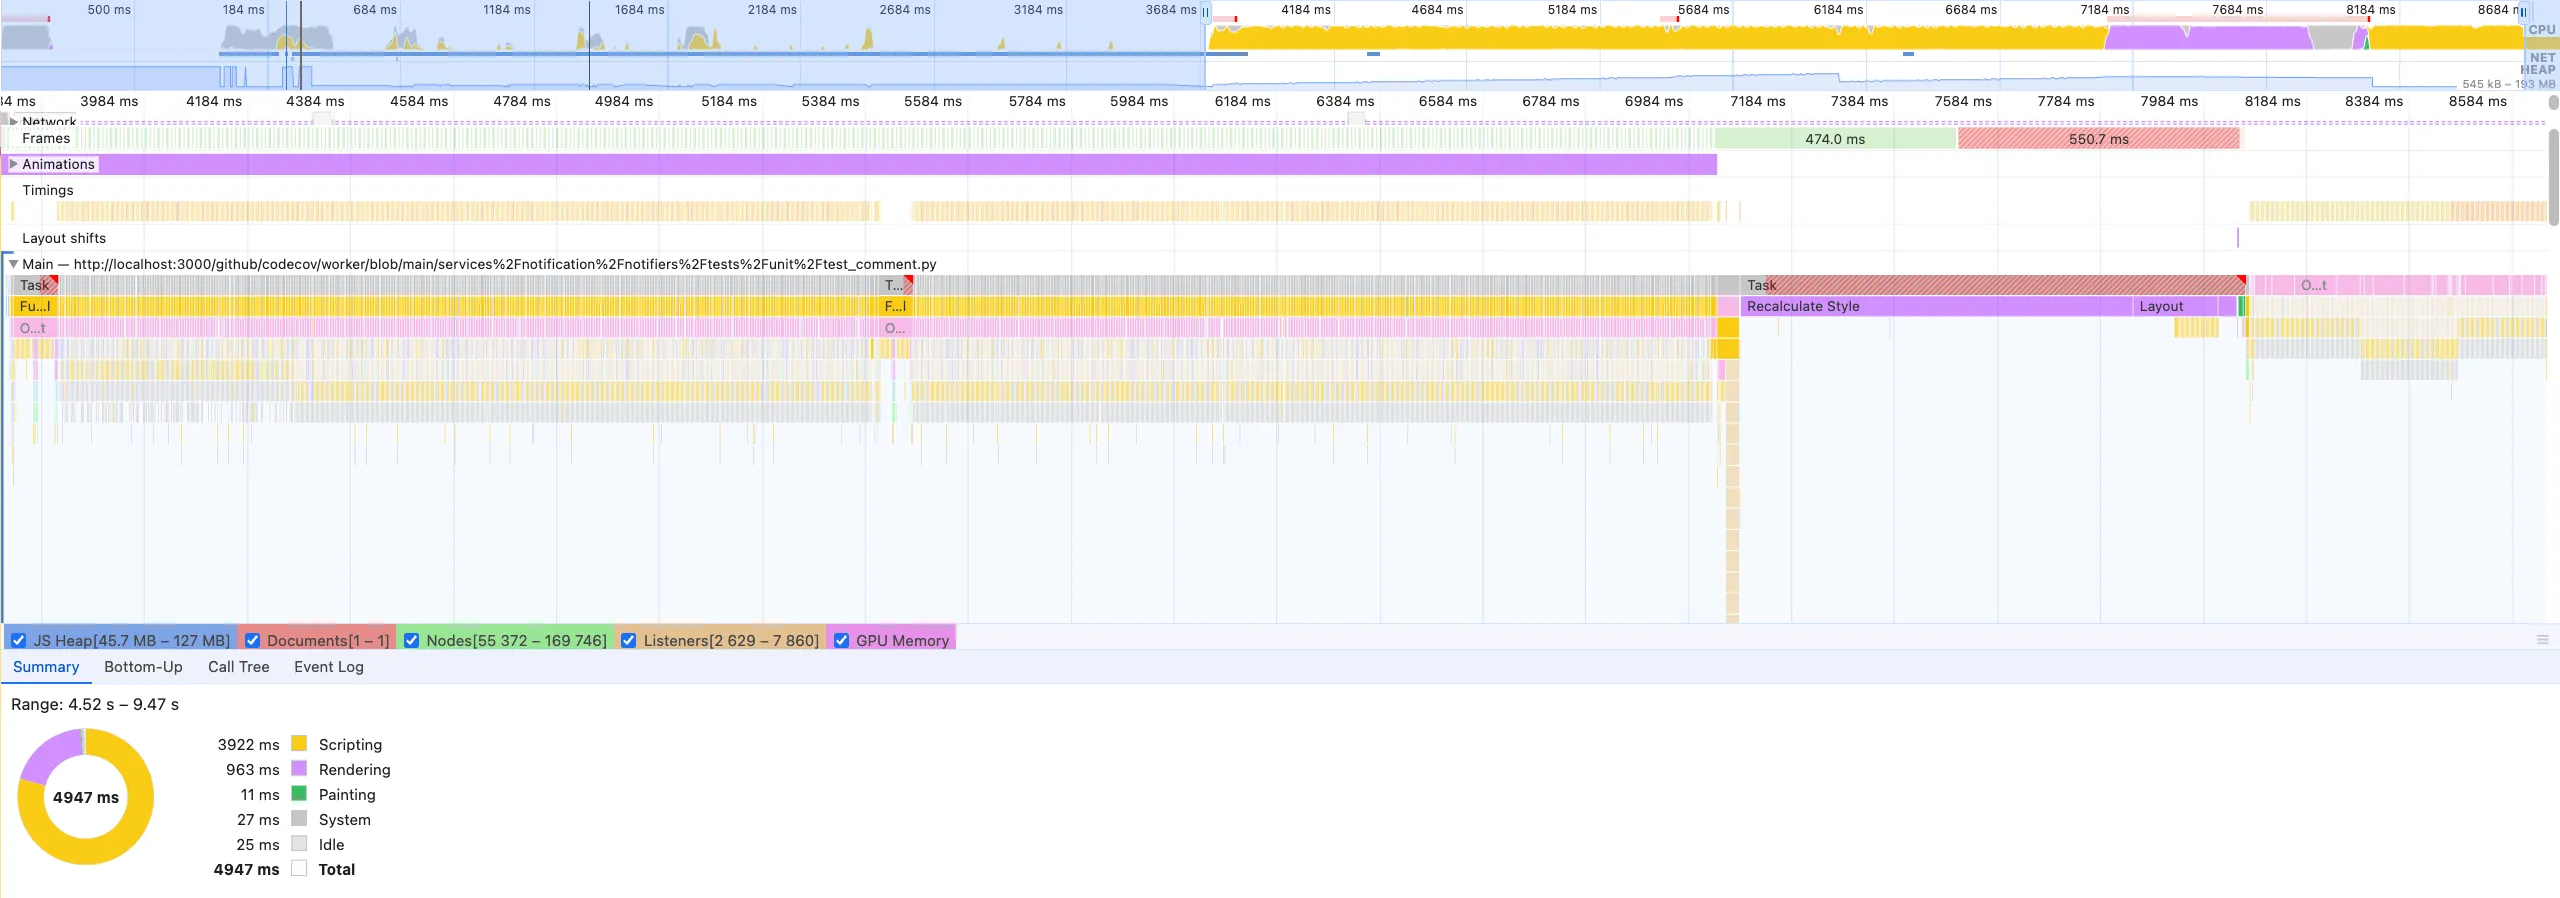
We can see it takes it takes around 5 seconds to render the example file, and there’s quite a few things going on here. Let’s try and actually find out where we are tokenizing the content, and then rendering it to the screen:
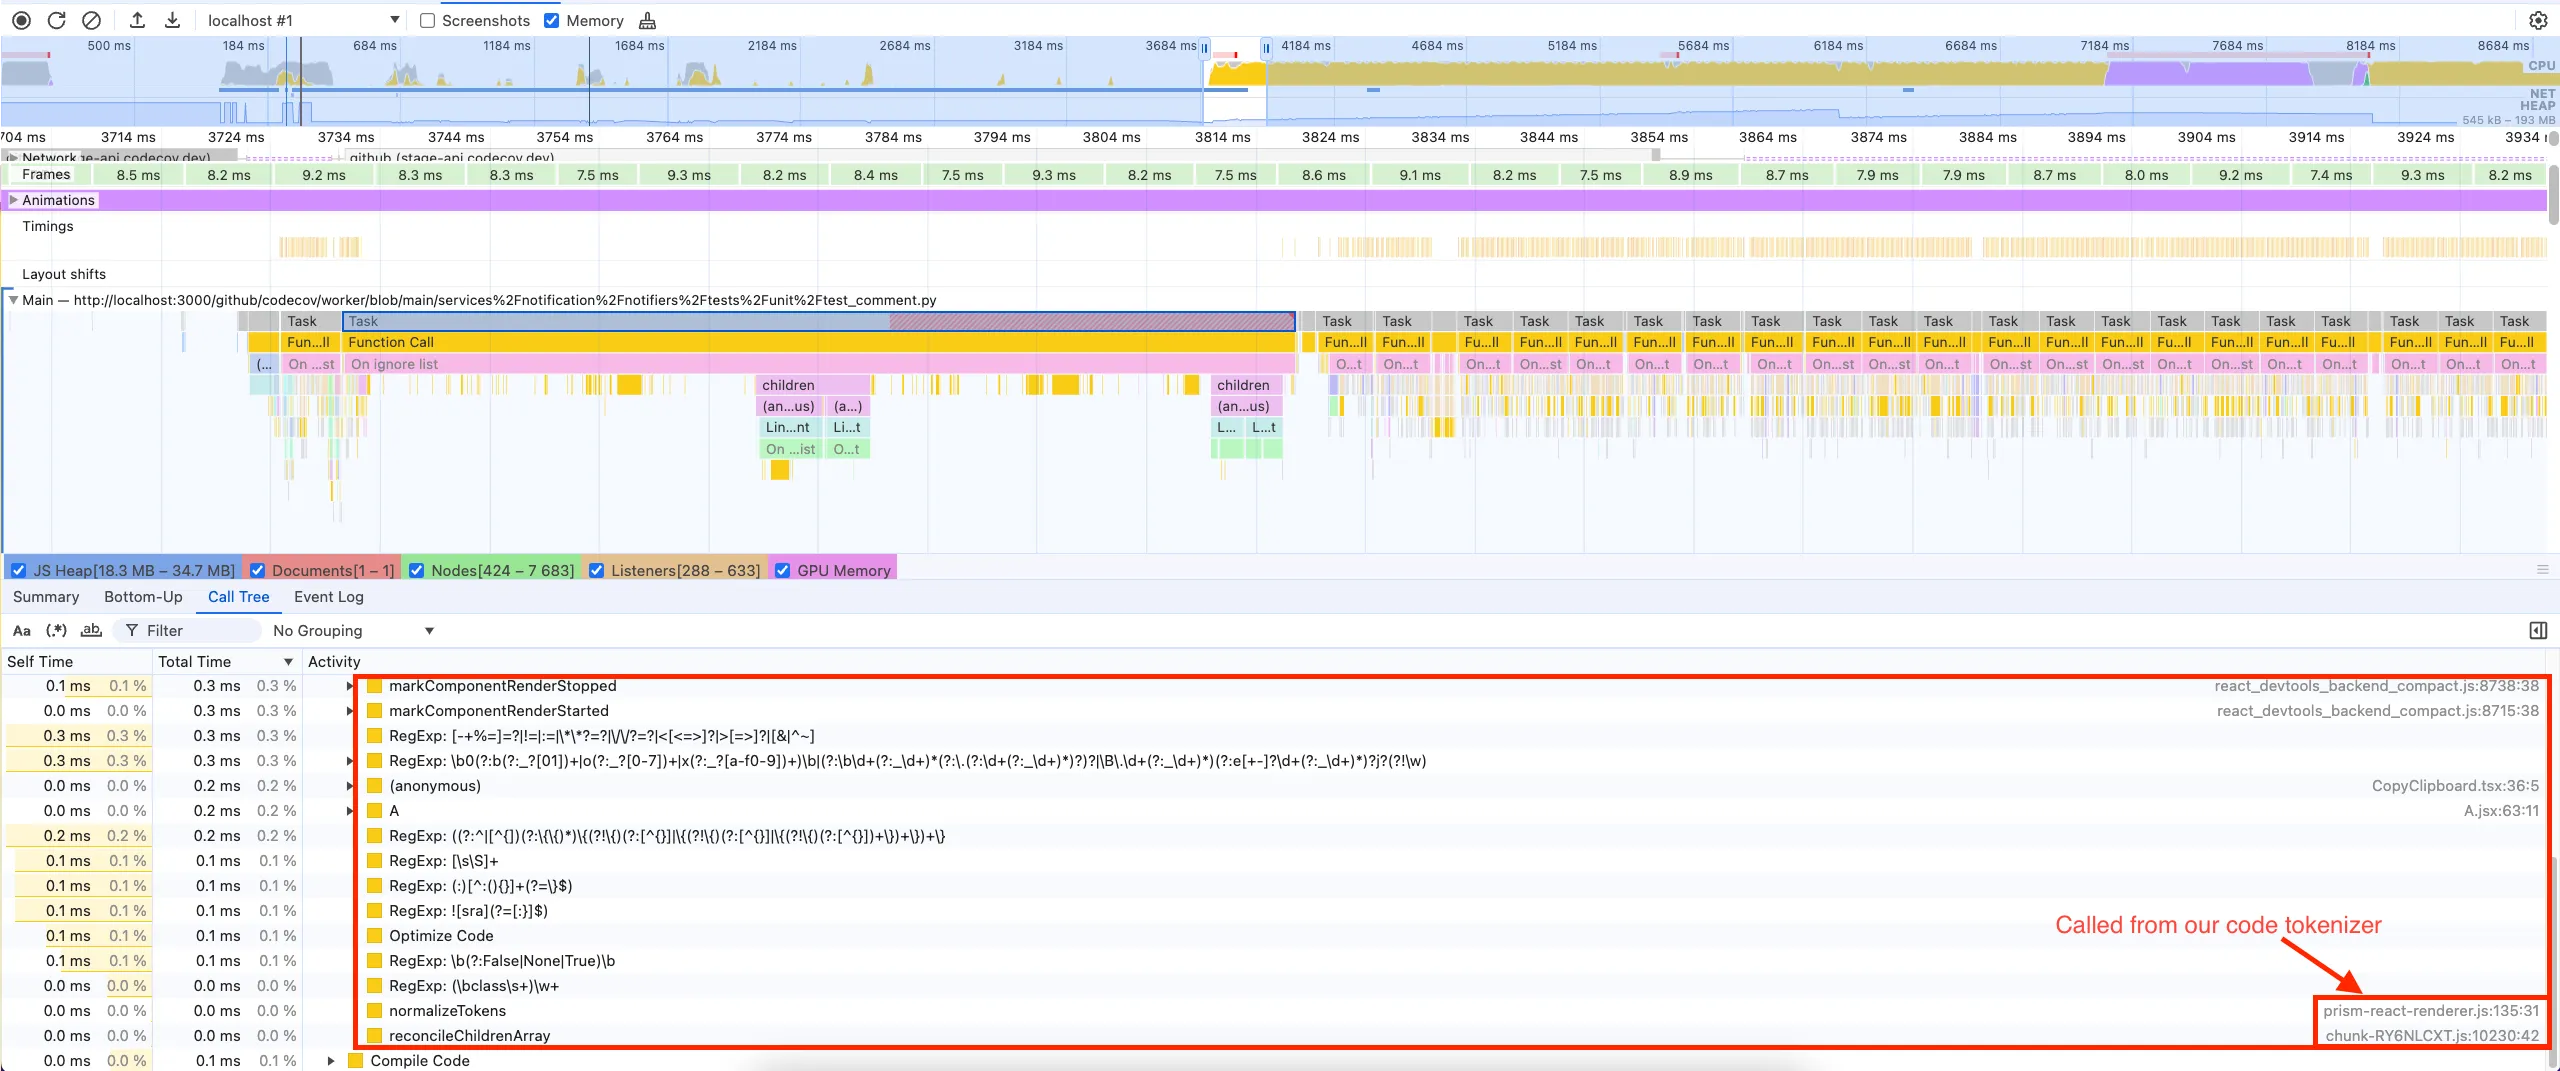
We can see from the call stack here that this task here is being called from the tokenizing package react-prism-renderer, we can then infer that this is the task we are looking for. We can see that the total time for this task is the work being done to process the file and provide us the tokens for render takes around 80-90ms for this file, which isn’t that bad in the big picture.
Let’s take a peek at all those other function calls:
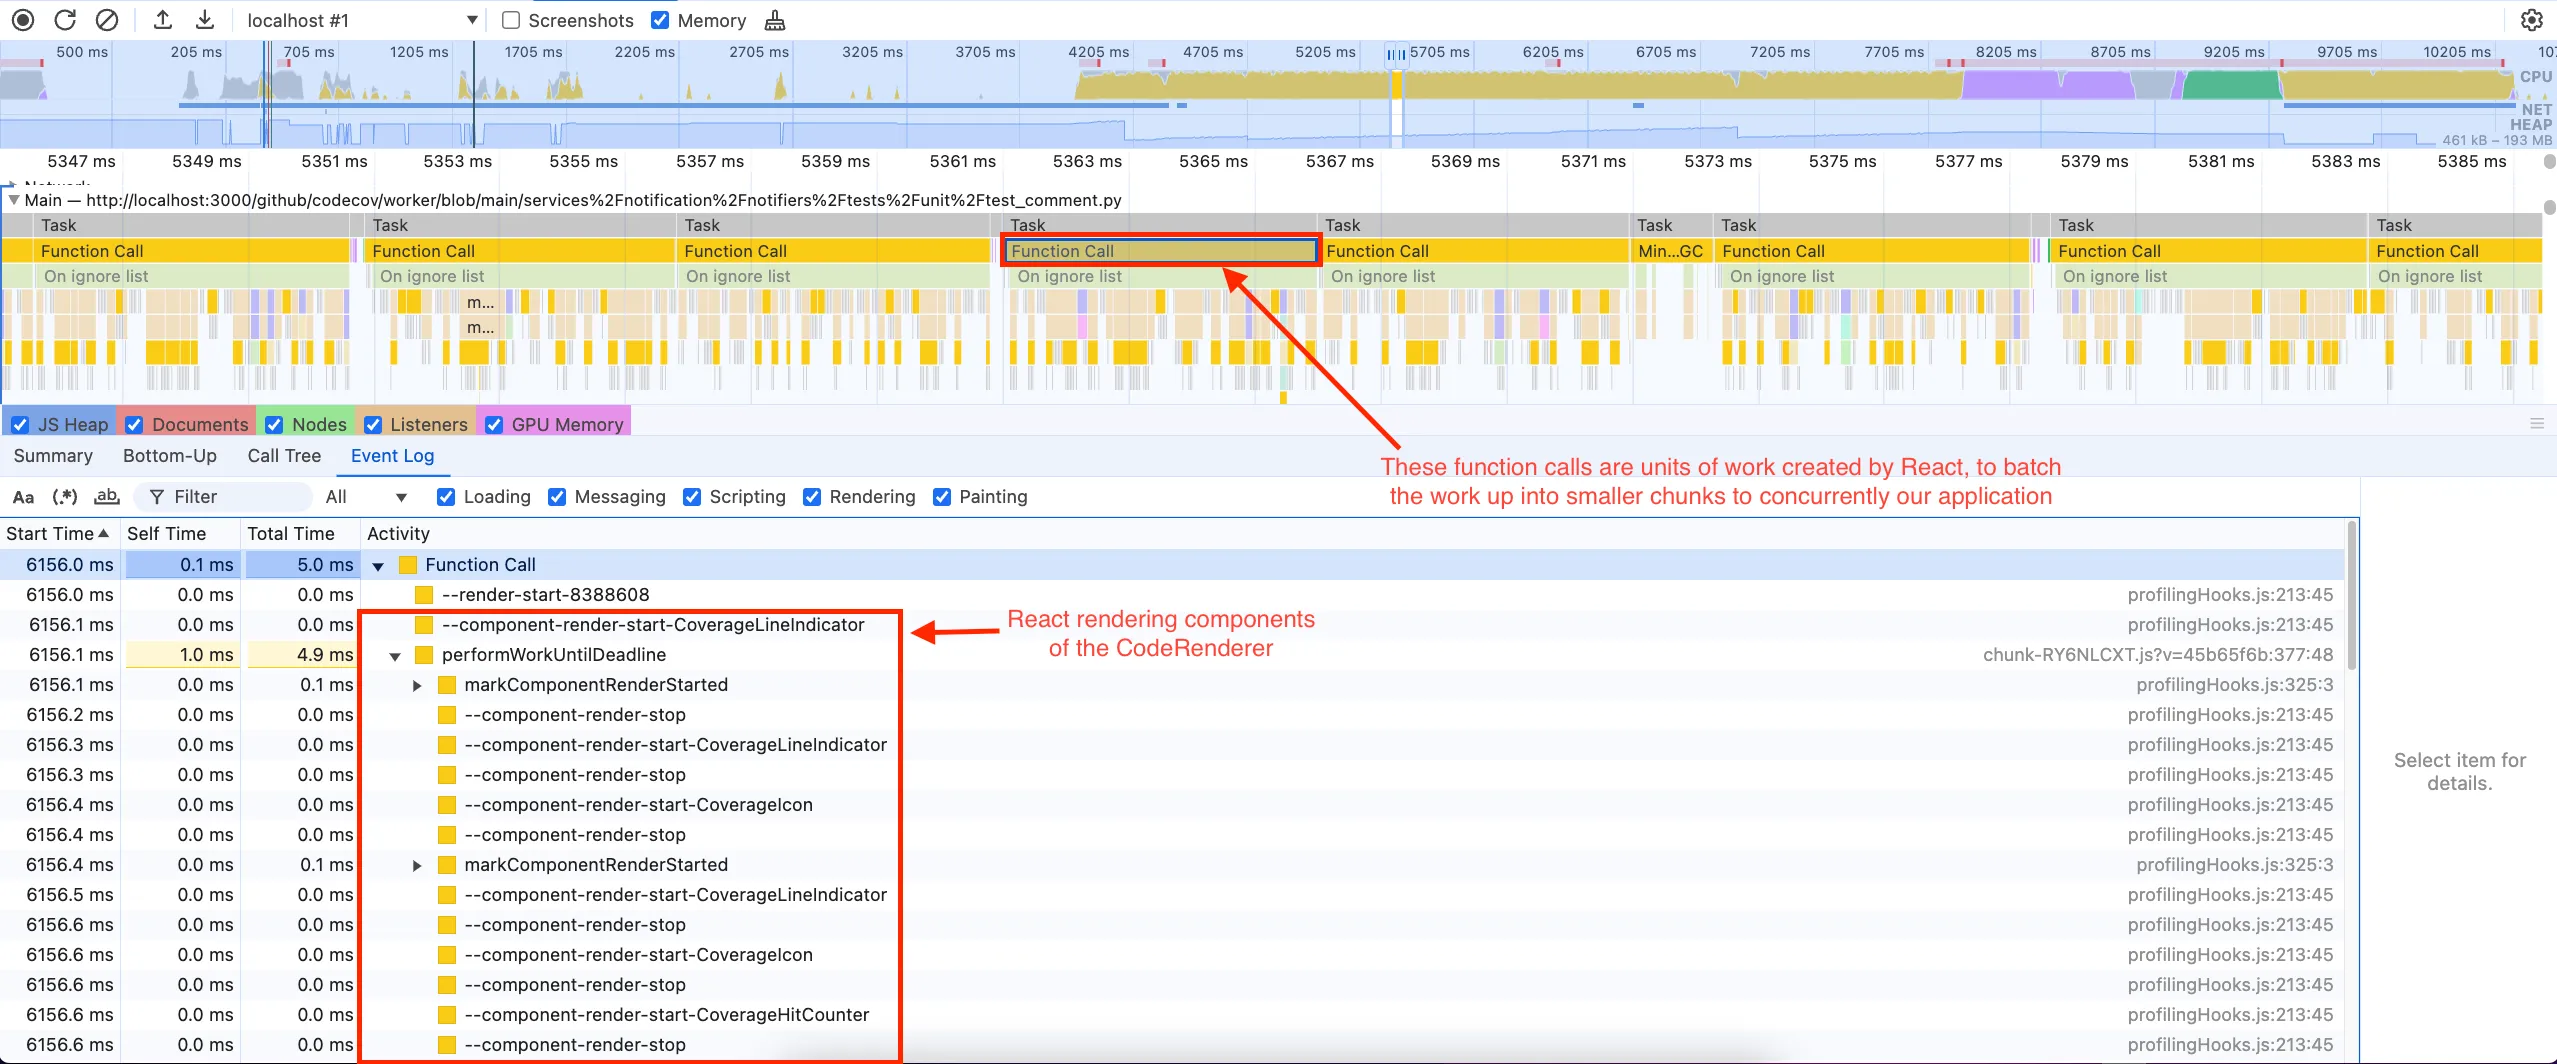
Diving a bit deeper into the flame graph we can see that these calls are actually React batch rendering the UI. Looking at this flame graph we can see that the majority of our blocking time is actually related to rendering and React struggling to flush to the screen.
To figure out roughly what our approximate render time per line is, we can use the following equation:

Entering our values from our example, we get the following equation:

If we take this value 0.897ms on average for rendering time, we can extrapolate that out to the example provided by our user, TypeScript’s checker.ts file, which has 52283 lines. Taking our rough estimate for rendering time per line and multiplying it with our line count from checker.ts we get the following equation:

With the rendering time taking roughly 46.90s we can ascertain that the underlying issue for rendering larger files is not the tokenization of those files, but actually the React attempting to render all of the tokenized content. The easiest solution for us to resolve this is to render less content to the screen, to accomplish this we can virtualize the code renderer.
Requirements
Before rebuilding our code renderer, it’s important to define clear requirements to ensure the solution meets user needs and technical expectations. These requirements will guide development and set measurable goals for success. For this project, they are:
- Ability to Render Large Files: The new renderer must efficiently handle files of significant size, such as TypeScript’s
checker.ts, without crashing or compromising performance. - Preserve Native Search Functionality: Users should continue to have seamless access to native search capabilities (e.g.,
Ctrl/Cmd + F) to locate content within large files quickly. - Support for Automatic Scrolling to a Given Line: The renderer must support automatic scrolling to a specific line, enabling direct linking to specific lines of code.
Ability to Render Large Files
To meet the primary requirement of building a renderer that can handle large files, we need to virtualize our code renderer. With virtualization, we’re able to reduce the overall amount of elements being rendered to the screen, rendering only the elements visible to the window and user, reducing the amount of rendering work React has to do.
The easiest way to introduce virtualization to your application is through using a third-party library, instead of attempting to write the logic ourselves. There are plenty of options out there for virtualization libraries for almost any framework, for our application however, we landed on @tanstack/react-virtual as it meets all the functionality requirements for our project, as well we are already using a couple other TanStack libraries and have had pretty good success with them.
For our renderer, we utilized the useWindowVirtualizer hook. The reason we choose this specific hook is that unlike the generic useVirtualizer, it is designed to set an elements height proportionally to that of the virtual content so the user is actually scrolling via the window rather than inside an HTML element. For our implementation, it looks a little like the following:
import { useWindowVirtualizer } from '@tanstack/react-virtual'

const CodeBody = ({ tokens, /* other props */}) => {
    const virtualizer = useWindowVirtualizer({
    count: tokens.length,
    estimateSize: () => LINE_ROW_HEIGHT,
    overscan: 45,
    scrollMargin: scrollMargin ?? 0,
  })

  return (
    <div ref={virtualDivRef}>
      <div
        style={{
          height: `${virtualizer.getTotalSize()}px`,
            width: '100%',
            position: 'relative'
        }}
      >
        {virtualizer.getVirtualItems().map((item) => (
          <div
            key={item.key}
            style={{
              position: 'absolute',
              top: 0,
              left: 0,
              width: 100%,
              height: `${item.size}px`,
              transform: `translateY(${
                item.start - virtualizer.options.scrollMargin
              })px`
            }}
          >
            {tokens[item.index]}
          </div>
        ))}
      </div>
    </div>
  )
}
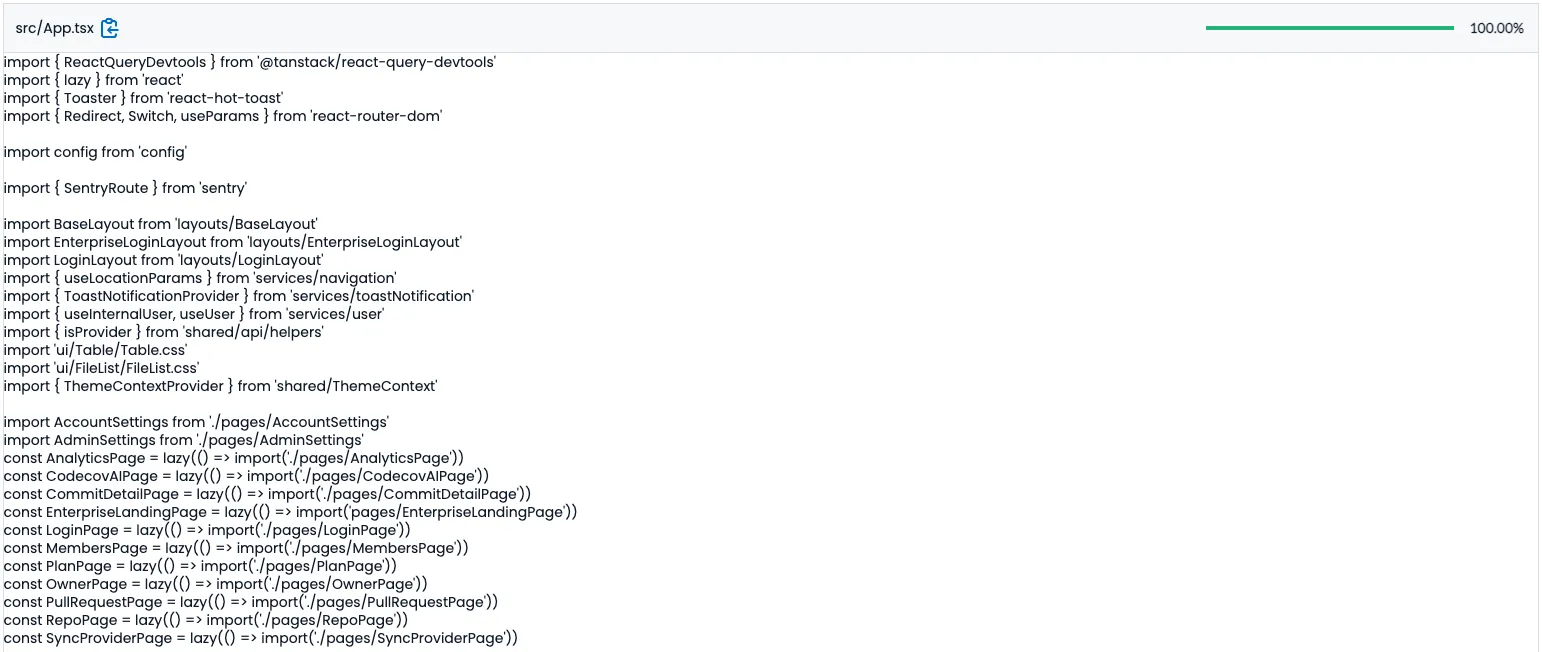
With this we’re able to get our code renderer rendering the content to the screen:
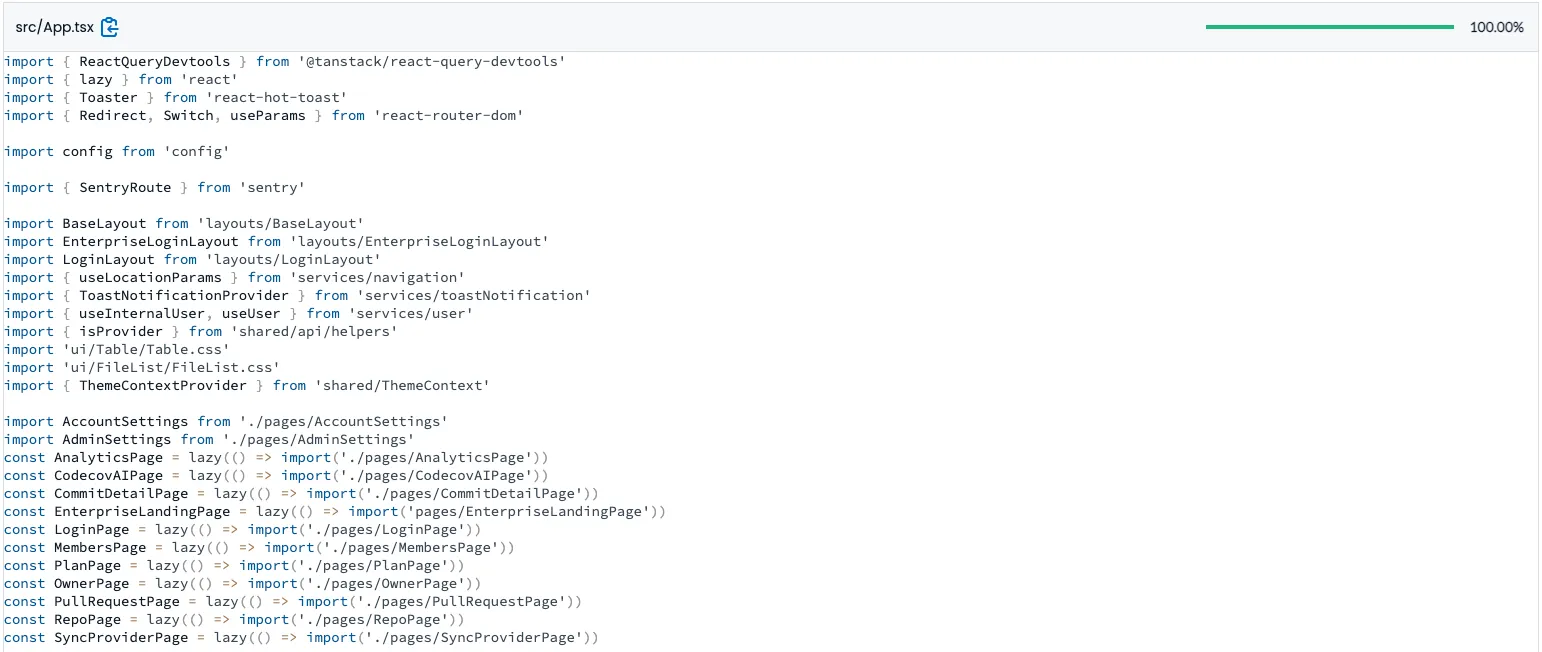
However, there is a bit more work that we need to do to properly tokenize the content, render the tokens, and style it, which we won’t go into detail here:
Preserving Access to Native Search
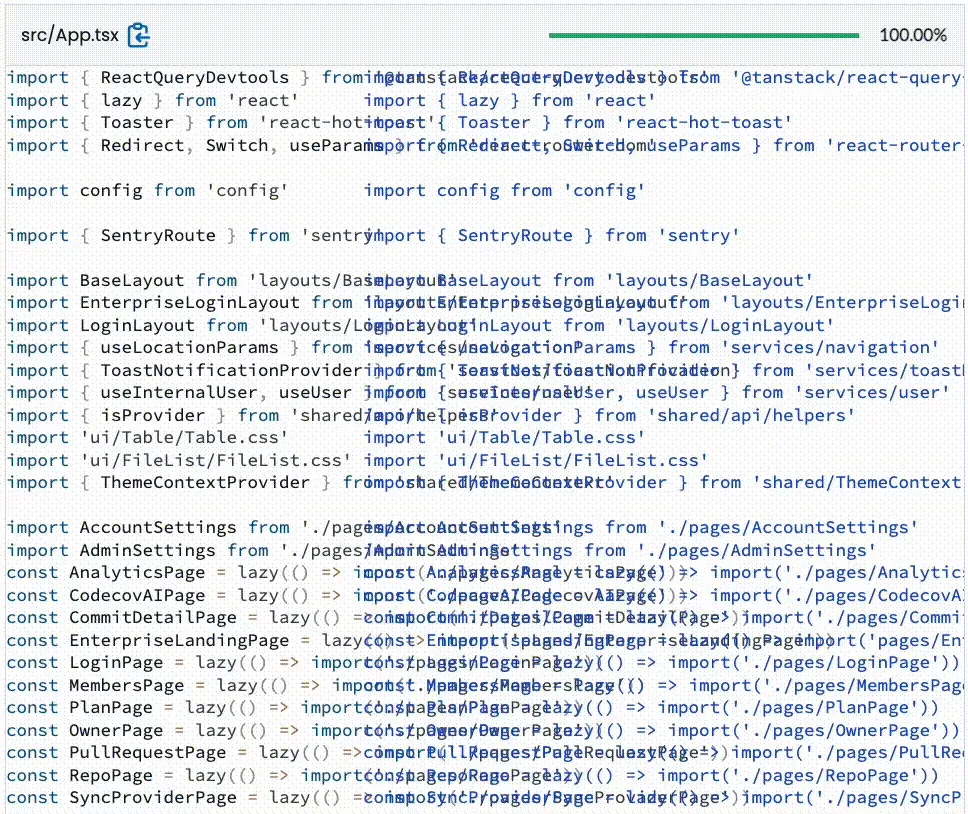
With the move to virtualization, we are no longer rendering everything to the screen, users are unable to use the built-in browser search to find code they were looking for, as the content is not present. After researching and exploring a few other code renderers on the web, we noticed that they were actually overlaying a one to one mapping of a textarea containing the content in its entirety, so that the content was fully present in the DOM as one large string.
After introducing this new textarea we had to to tweak its styles this textarea so that we could overlay the textarea correctly, ensure that it was above the highlighted code for user interactions, ensure that the text styling matched that of highlighted code, and finally make sure that the highlighted code is actually visible. To accomplish this we can use the following styles:
- Setting position to absolute
- Enabling the
textareato overlay the virtual content pixel for pixel
- Enabling the
- Z-index of 1
- Ensuring that user interactions are handled via the
textarea
- Ensuring that user interactions are handled via the
- Setting white-space to
pre- Preserves newlines and spacing, while ensuring text will not be wrapped
- Color set to transparent
- So the user can see the styled code underneath
Resolving Scrolling Challenges with Virtualized Rows
Due to the way virtualization works, and to simplify its implementation, we removed line wrapping for longer lines, aligning with the approach used by other popular code renderers. However, this introduced some new challenges. Since we were no longer rendering the entire highlighted content, the div containing the code would dynamically change its width as the user scrolled. Additionally, because the textarea overlaid the highlighted content, users were only scrolling the textarea, leaving the highlighted code stationary.
The first issue we addressed was the varying widths of each line. We wanted all lines to have the same width to avoid scrolling inconsistencies and allow users to horizontally scroll anywhere. To achieve this, we needed to do two things: track the maximum possible width and apply it to all lines of code. To determine the maximum width, we measured the textarea’s width, as it contains all lines of code, and thus the max width possible. We applied this width to the virtually rendered lines, ensuring they are set to the max width possible. You can view the source code for this here:
- Tracking widths: src/ui/VirtualRenderers/VirtualFileRenderer.tsx
- Applying widths: src/ui/VirtualRenderers/useSyncTotalWidth.ts
Now that we have the correct widths set, there’s still an issue where, when the user attempts to scroll, as they’re actually interacting with the textarea, causing the highlighted code to remain stationary. To resolve this, we need to synchronize the scrollLeft values of the textarea and the div that contains all the highlighted code and line numbers. This synchronization can be achieved using an event listener that triggers when the user scrolls the textarea. Here’s an example of how we accomplish this:
// this effect syncs the scroll position of the text area with the parent div
useLayoutEffect(() => {
  // if the text area or code display element ref is not available, return
  if (!textAreaRef.current || !codeDisplayOverlayRef.current) return;
  // copy the ref into a variable so we can use it safely in the effect cleanup
  const clonedTextAreaRef = textAreaRef.current;

  // sync the scroll position of the text area with the code highlight div
  const onScroll = () => {
    if (!clonedTextAreaRef || !codeDisplayOverlayRef.current) return;
    codeDisplayOverlayRef.current.scrollLeft = clonedTextAreaRef?.scrollLeft;
  };

  // add the scroll event listener
  clonedTextAreaRef.addEventListener("scroll", onScroll, { passive: true });

  return () => {
    // remove the scroll event listener
    clonedTextAreaRef?.removeEventListener("scroll", onScroll);
  };
}, []);
Supporting Automatic Scrolling to Line
Lastly, we need to add support so that users can create shareable links that automatically scroll to a given line when the link is accessed. There are two problems to solve here: adding line numbers for users to interact with and ensuring the page scrolls to the specified line when rendered.
Supporting native searching while adding line numbers introduces additional complexity. Previously, line numbers were rendered alongside the code, but with our virtual rows positioned behind the textarea, users cannot interact with them. To address this without adding significant runtime overhead, we need to implement a slightly different approach.
By leveraging our virtualizer and z-index properties, we can virtually render the line numbers, keeping them in sync with the virtual code rows. This approach ensures that only a subset of line numbers is rendered at any given time, minimizing the total number of elements.
To make the line numbers interactive, we can use a z-index value slightly higher than the textarea, allowing the line numbers to overlay it and remain accessible to users.
To create shareable links, we can store the selected line number in the URL’s hash property, a common practice among online code renderers. This update to the URL will be triggered when the user clicks on a specific line number.
const CodeBody = ({ tokens, codeContent /* other props */ }) => {
  return (
    <div>
      <textarea value={codeContent} style={{ zIndex: 1, color: "transparent" }} />
      <div ref={virtualDivRef}>
        <div style={{ zIndex: 2 }}>
          {virtualizer.getVirtualItems().map((item) => (
            <LineNumber item={item} onClick={() => updateURLHash(item.index)} />
          ))}
        </div>
        <div style={{ zIndex: -1 /* prev styles */ }}>
          {virtualizer.getVirtualItems().map((item) => (
            <RowOfCode item={item} />
          ))}
        </div>
      </div>
    </div>
  );
};
Finally, we need to bring everything together so the application responds correctly when a user navigates to the site. Using a useEffect hook allows us to tap into the component’s lifecycle, ensuring the effect runs and syncs with the selected line in the URL when the component is rendered.
To prevent the virtualizer from scrolling unnecessarily whenever a user selects a new line, we use refs. Refs are ideal for storing and updating values between renders as they avoid triggering a re-render, and in turn triggering the effect.
For handling the actual scrolling, the scrollToIndex method on the virtualizer object provides the functionality we need. By passing the desired index, this method scrolls to the correct position in the viewport and centers the content.
import { useEffect, useRef } from "react";
import { useWindowVirtualizer } from "@tanstack/react-virtual";

function VirtualCodeRenderer({ rowsOfCode, codeContent }) {
  const initialRender = useRef(true);
  // configure virtualizer

  useEffect(() => {
    if (!virtualDivRef || !initialRender.current) return;
    initialRender.current = false;
    const lineNumber = location.hash;
    // little bit of defensive programming ensuring that the
    // line number is within the bounds of the file
    if (lineNumber > 0 && lineNumber < rowsOfCode.length) {
      // because our line numbers are indexed at 1, we need
      // to subtract one to scroll to the right element
      virtualizer.scrollToIndex(index - 1, {});
    }
  }, [location, rowsOfCode.length, virtualizer]);

  // render component
}
Other Fixes and Improvements
Using Sentry to Detect Unsupported Languages
During the implementation of the new renderer, we noticed that the amount of languages that we supported highlighting for was not that many, and we should put in some effort to support more languages. However, adding in more language support can have a significant impact on bundle sizes, so we wanted to approach this in a way where we could determine what languages we were missing, and how many use cases there were for the given language. We once again reached for Sentry to capture and create an issue whenever we detected a language that we did not support:
if (supportedLanguage) return supportedLanguage as Language;

Sentry.captureMessage(`Unsupported language type for filename ${fileName}`, {
  fingerprint: ["unsupported-prism-language"],
  tags: {
    "file.extension": fileExtension,
  },
});
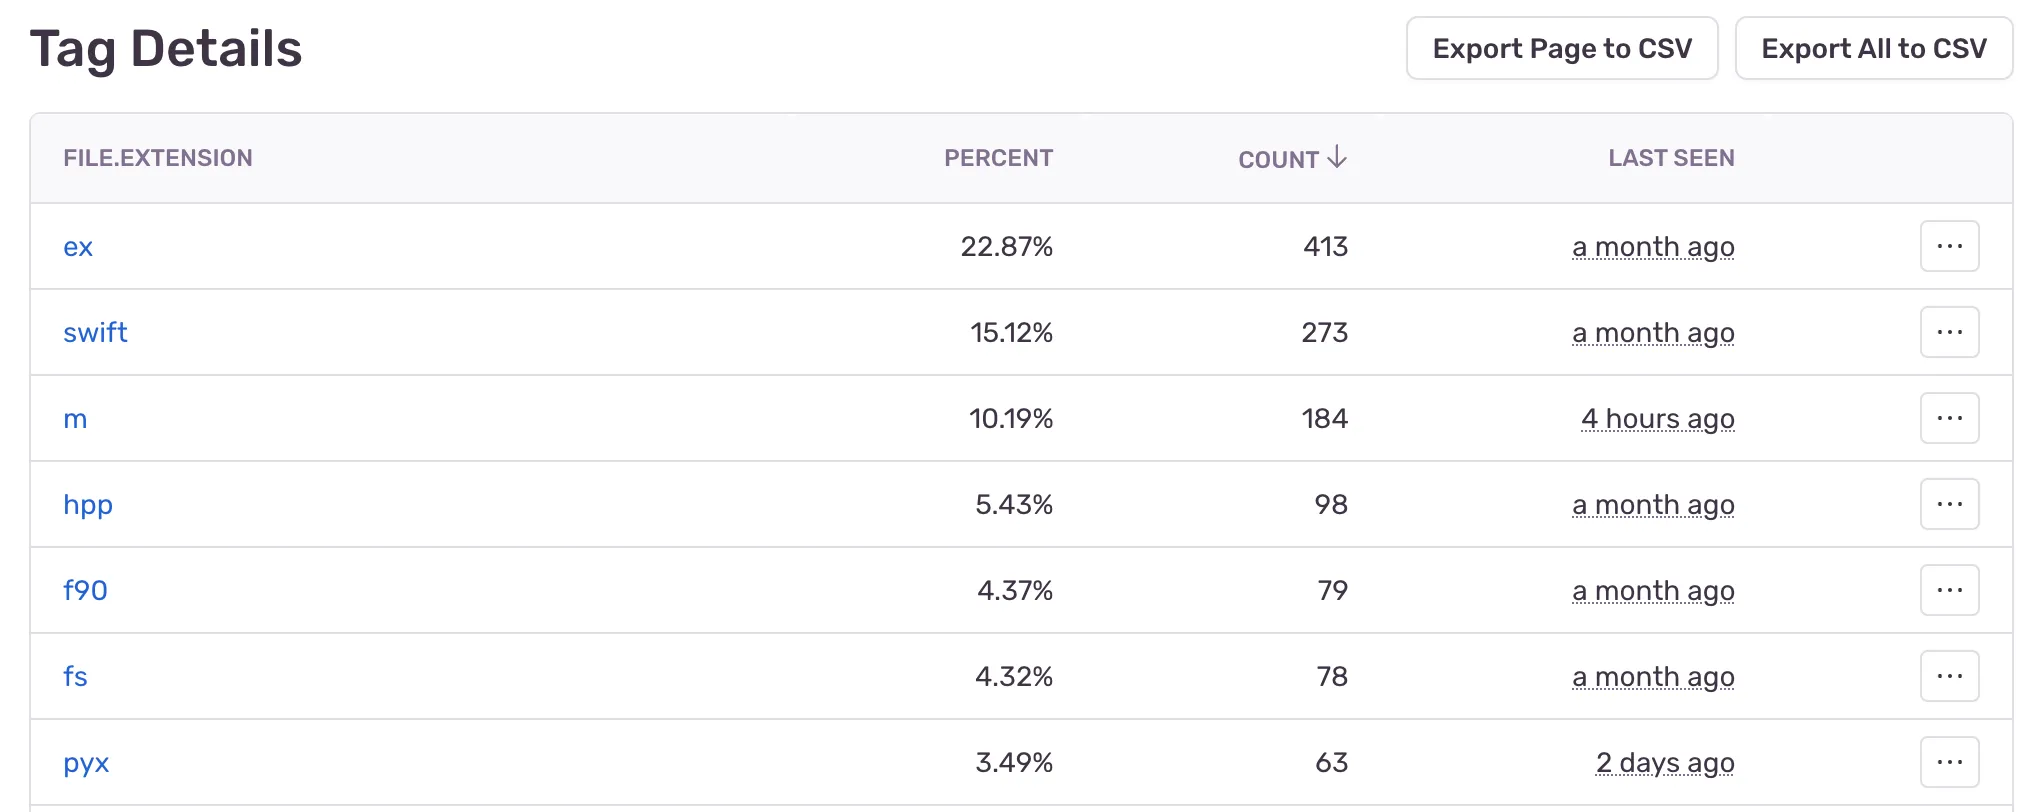
Using the fingerprint, we were able to utilize Sentry’s ability to merge the issues together, even though the message was different for each one. We also created a custom tag so that we could easily see what the frequency of each file extension was so we could determine which languages needed to be added before others:
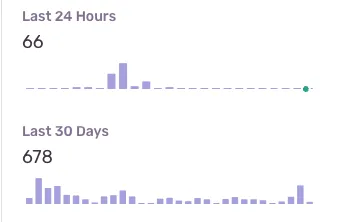
We can also see that overtime the amount of events have gone down, validating that our changes have worked, and we’re now highlighting more changes:
Disabling Pointer Events for Smoother Scrolling
In our previous renderer we had implemented a small UX improvement where we would disable pointer events while the user was scrolling, and re-enable them after they had finished. This is a fairly common optimization with virtualized libraries as we’re removing calculations the browser has to compute while scrolling while also updating the virtual list and rendering it to the screen. To accomplish this, we have an effect that will add a scroll event listener to the window, and whenever it detects the user is scrolling we update the pointerEvents style on our VirtualCodeRenderer to 'none' and queue up an animation timeout to reset pointerEvents to 'auto' 50ms after the user has stopped scrolling.
Before:
You can see in the below flame graph, the performance tools have highlighted a couple of events where we are are having to recalculate styles because of forced reflows. When these events occur the browser is forced to calculate layout changes right away instead of batching them.

After:
As you can see in the following trace, we have removed all of these forced reflow events, removing the requirement for the browser to calculate layout changes immediately.

Creating Custom Horizontal Scrollbars
Once we had finished up adding virtualization to our main code renderer, we also decided to bring it to our diff renderer, which we use when viewing commits or pull requests on Codecov. It was a fairly straightforward implementation, however we ended up running into an issue with our horizontal scrollbars overlaying the last line of code obscuring it from the user. This happens because our virtualizer is not taking into account the height of the horizontal scroll bar when it estimates the total height of our content.
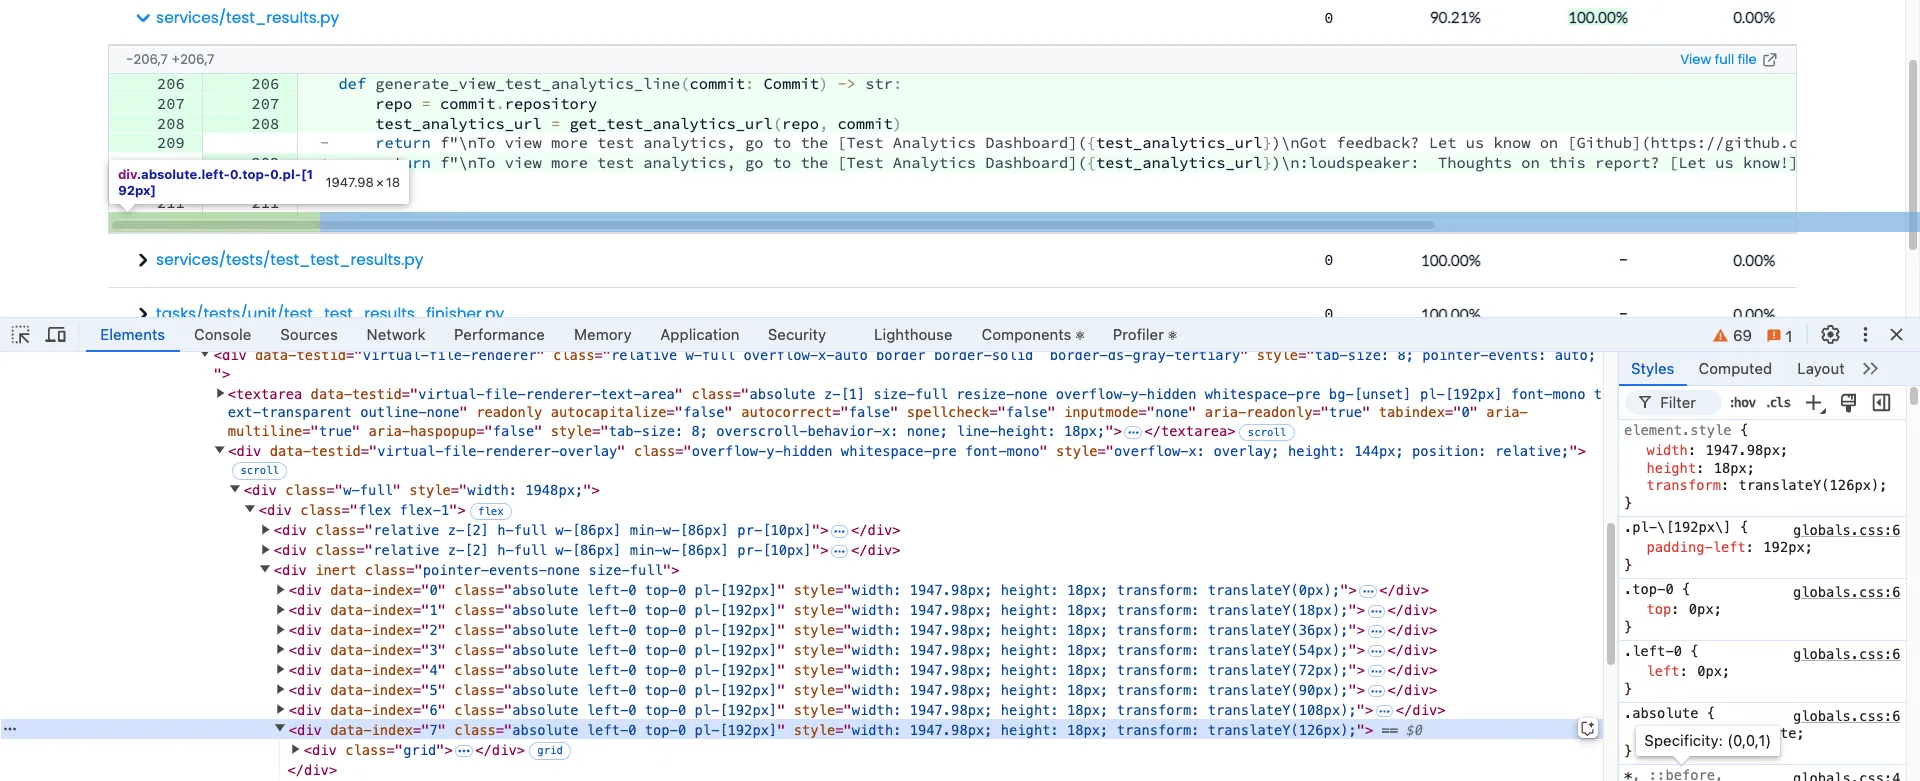
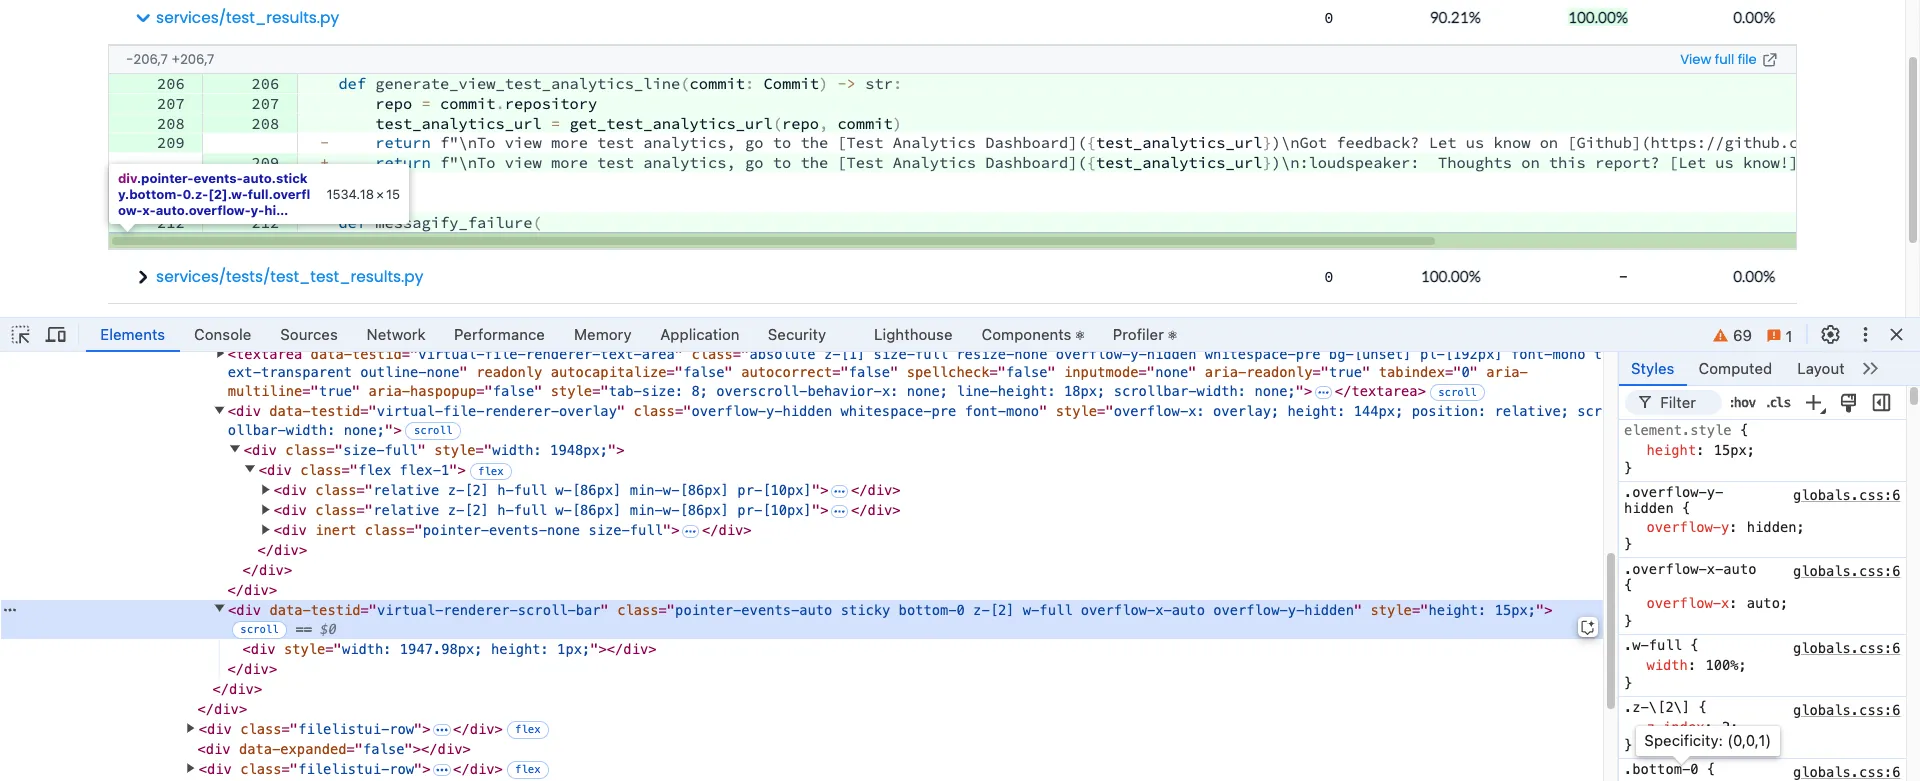
We ended up going over to GitHub for some inspiration as to how they handle this issue, and it turns out they actually create their own scroll bar. This scrollbar is placed after the virtual content so it is unaffected from any styling that is being done for the virtual content:

With this inspiration we decided to create our own scrollbar in the same fashion, this was a fairly trivial implementation utilizing some of the previous hooks we had to create to handle different issues such as syncing scroll positions between all three elements, and ensuring the correct width is being set. We did have to introduce one new hook however, this hook detects whether or not the content is overflowing and requires a custom scrollbar. This hook is hooked up with a ResizeObserver so we are able to dynamically add in a scrollbar if the user resizes their window.
If you’re interested in checking out our implementation you can checkout out the following source code:
useIsOverflowing: src/ui/VirtualRenderers/useIsOverflowing.tsScrollBar: src/ui/VirtualRenderers/ScrollBar.tsxuseSyncScrollLeft: src/ui/VirtualRenderers/useScrollLeftSync.ts
The Result
Through virtualizing lists, layering textarea’s, and much more, we were able to build a renderer that was easily able to handles TypeScript’s checker.ts file. We decided to do some further stress testing to see where the limits would be reached, and we found that to be around 500,000 lines of code. At this point, the browser itself started running into issues running out of memory and crashing.

At the end of the day, the most important thing we accomplished is being able to provide our users with a great experience (even on their phone):
