Measuring Session Replay Overhead
A very common question that we receive regarding Session Replay is, “what is the overhead?”.
Overhead can mean different things for different companies. Every company has their own performance budgets: a large consumer product will be different than a SaaS start-up, and a marketing page will be different than an authenticated single-page application. The best way to figure out how overhead impacts you is to measure it yourself.
We’ve built a web benchmark package to demonstrate the overhead of Session Replay on Sentry and on your own application too.
Follow along as we show you how we measure overhead on Sentry and how you can measure it on your applications, or skip ahead to learn how to measure your application.
Metrics
In order to measure overhead, we first need to determine what metrics to measure. We will be capturing a combination of “traditional” system resources as well as more modern, web-focused metrics in Web Vitals.
Processing
As a refresher, Session Replay works by recording a snapshot of the browser’s DOM state and the incremental mutations to the DOM. Our SDK needs to perform tasks such as:
- Serialization so that user interactions can later be played back, and
- Determine if the element’s text contents need to be masked.
Finishing these tasks faster means less blocking of the browser’s main thread, which ultimately means a better experience for your users. Even better, Sentry performs CPU intensive tasks like compression on a web worker, which does not run on the main thread.
Memory
Google presents three common memory problems and their effects on page performance. An increase in memory consumption does not necessarily mean it will negatively impact your application, but knowing how much it increases is helpful in the evaluation process. It’s more important that there are no memory leaks where memory can grow unbounded over time.
With Session Replay, we have two sampling modes that differ in memory usage due to the amount of event buffering required. Entire session replays only buffer a few seconds worth of data as it is constantly uploading to Sentry. However, replays that record only on error need to buffer for longer periods as we want to give you enough context before the error happens to make the replay useful. This buffer is reset on an interval so that it does not grow infinitely.
Network
The amount of network traffic used is not an issue for those with fast network connections, but can be a factor for mobile users with slower data access. Session Replay generally uploads more data than other Sentry SDK features as it needs to essentially record a clone of your HTML/CSS, as well as any updates to it. By default, the Session Replay SDK compresses the recording payloads before uploading to reduce the amount of data sent. The amount of data depends on the size of your application, how much the user is interacting with it, and how much the DOM changes. If the user is using up their available bandwidth to upload a replay, it means they won’t have any to fetch updates on your application.
Web Vitals
We also included Google’s Core Web Vitals as they are a somewhat accepted standard for the industry. These metrics help track the user experience across different stages of the application: loading, interactivity, and visual stability. Sentry also captures these metrics in Performance monitoring. If you are already a Sentry Performance customer, you can enable Replay and see if it affects your application negatively.
Automation
Having established the set of metrics that need to be collected, now the question is how do we go about collecting them? Ideally, this collection happens in a browser environment to simulate conditions that more closely represent a real user. Additionally, we’ll want to be able to programmatically control the browser so that the process is automated and we can collect a larger number of samples, for better data precision. Fortunately, there are many tools that can accomplish this for us; however, the one we’ll be using is Playwright as it has some additional tooling that is helpful to get started quickly.
Creating a Test Scenario
Using the Playwright API we can create a set of instructions that make up a scenario to be run on your web application, while capturing the metrics outlined above. The scenario can be as simple as loading a landing page, or more involved like running an important workflow, or loading a page that is performance sensitive where you want to maintain performance stability.
Below is an example snippet of code that opens up a browser, navigates to Sentry, clicks the “Pricing” link in the top navigation bar, and closes the browser after 5 seconds:
const { chromium } = require("playwright")(async () => {
  const browser = await chromium.launch({ headless: false });
  const context = await browser.newContext();
  const page = await context.newPage();
  await page.goto("https://sentry.io/welcome/");
  await page.getByRole("navigation").getByRole("link", { name: "Pricing" }).click();
  setTimeout(async () => await browser.close(), 5000);
})();
Gathering Metrics
Modern browsers provide a Performance API to measure the performance of a web application. In our case, we want to use a Performance Observer in order to measure a web vital such as LCP. We can use Playwright’s addInitScript to inject the performance measurement code before navigating to the page. Finally, we can extract the metrics by using the Playwright API evaluate to run code on the browser which then returns the results back to the initiating script.
In addition to the Performance API, we can also connect to the Chrome DevTools Protocol for metrics that are not reported by the Performance API. Playwright, again, has an API for communicating with the raw protocol. We won’t get into the specifics here, but you can read more about example CDP recipes here. (Note these are for Puppeteer, but they should be easily adaptable to Playwright).
Measuring Your Application
We packaged together the above ideas into a package to measure performance overhead in any web application. In the following section you’ll clone and test a demo app to ensure your environment is setup, create your own scenario using Playwright Codegen, and run Sentry’s benchmarking script on your newly created scenario.
We have setup a small bootstrap repo to help you get started quickly. First, make sure that you have Node.js ≥ 18 and git installed and then clone the following repository and run npm install.
git clone https://github.com/getsentry/web-benchmark-demo && cd web-benchmark-demo
npm install
Verify that everything is working by running the benchmarking tool on our demo scenario:
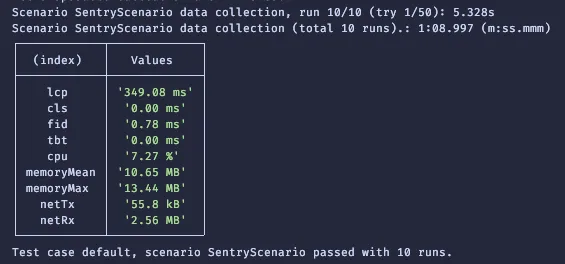
npx @sentry-internal/web-benchmark -f demo.mjs -c 5A Chromium window should open and navigate to https://sentry.io. After a short period, your terminal should have output resembling the following:
Creating Your Own Scenario
Now that you have confirmed that your environment is ready and working, we can go ahead and create a Playwright scenario that will load your own application. If you are already familiar with the Puppeteer or Playwright API, feel free to skip the following section on using Playwright’s code generation tool to create your scenario.
Playwright Codegen
Playwright has a tool that helps you create a scenario by translating the actions that you take inside of a browser into code. To get started, in your command line:
npx playwright codegen <URL to your application>Two windows should open: a Chromium (browser) window that loads the URL you input in the command line and a Playwright Inspector window.
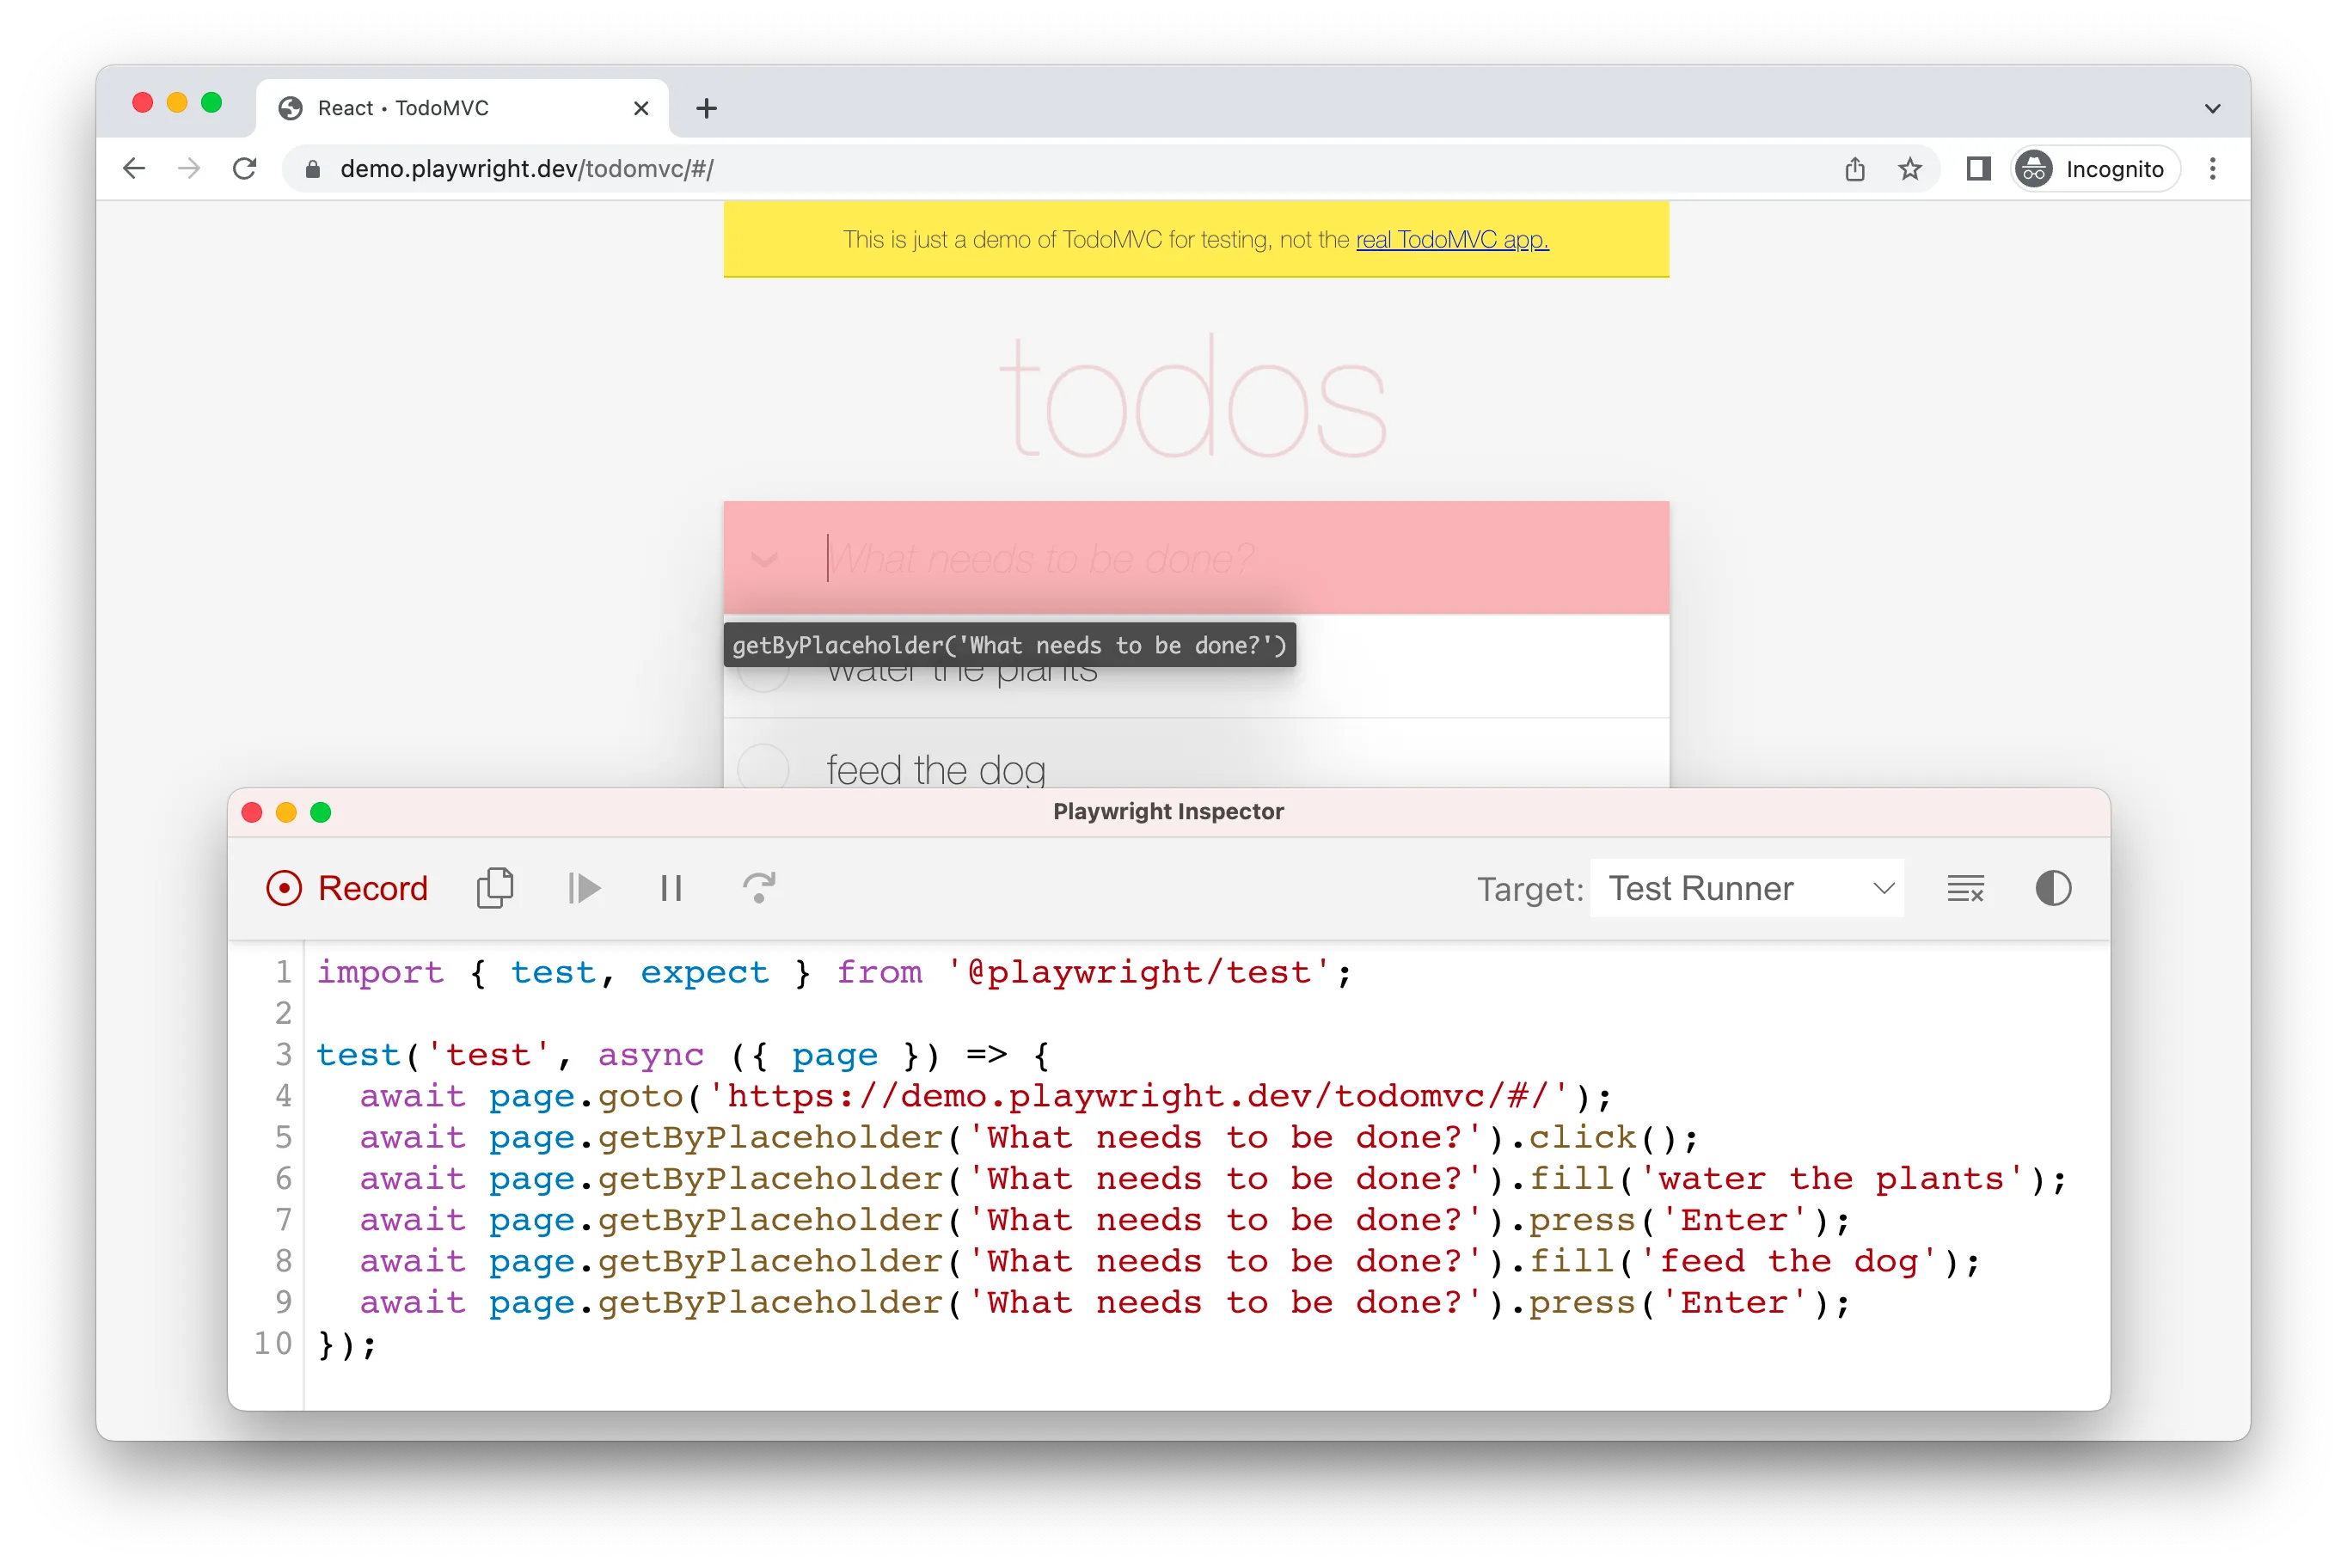
From here, you can interact with the browser window and create a scenario that you will run multiple times to record many sets of measurements. The corresponding code will be generated in the Playwright Inspector window. When you are finished, in the Inspector window, change the “Target” dropdown from “Test Runner” to “Library” (Node.js).
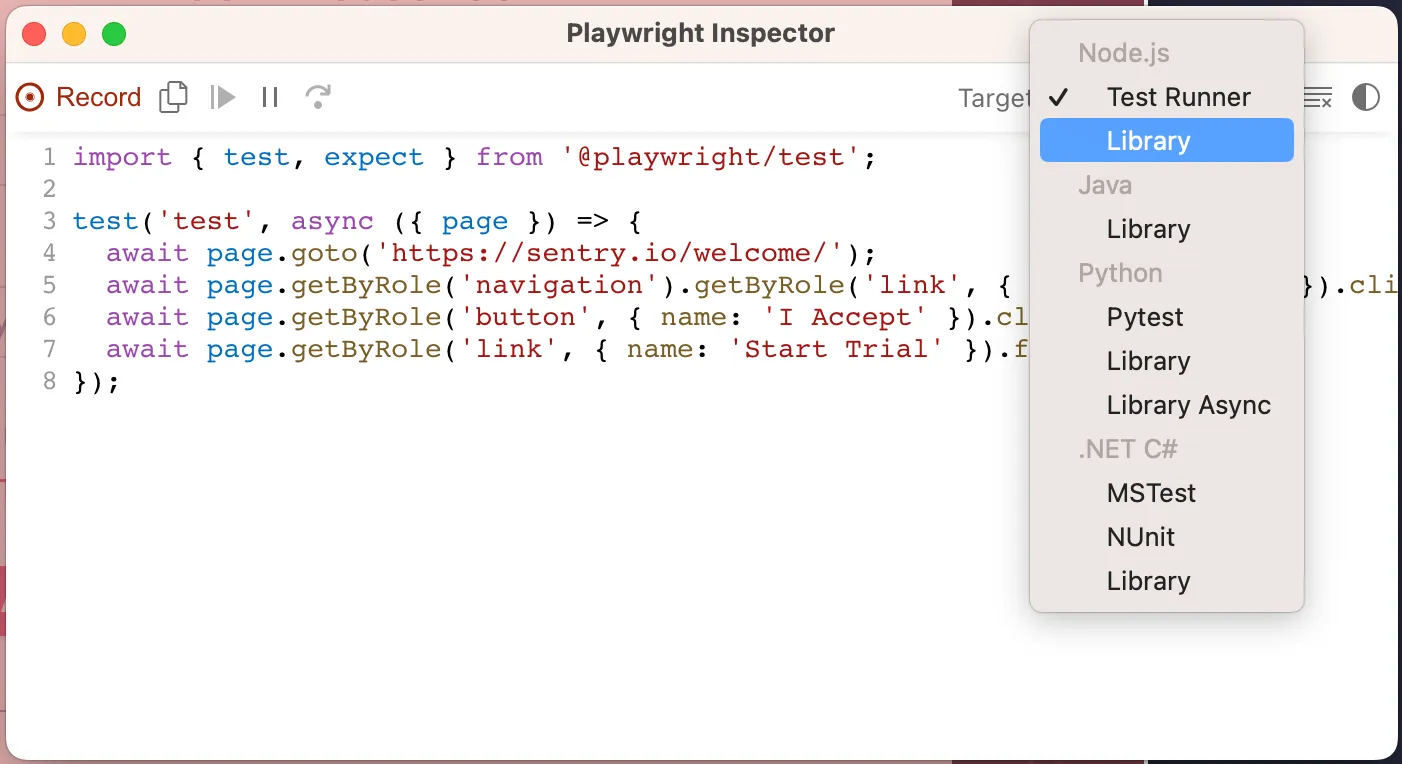
When the code gets changed to use the Playwright Library API, copy the code starting from page.goto, until the commented line.
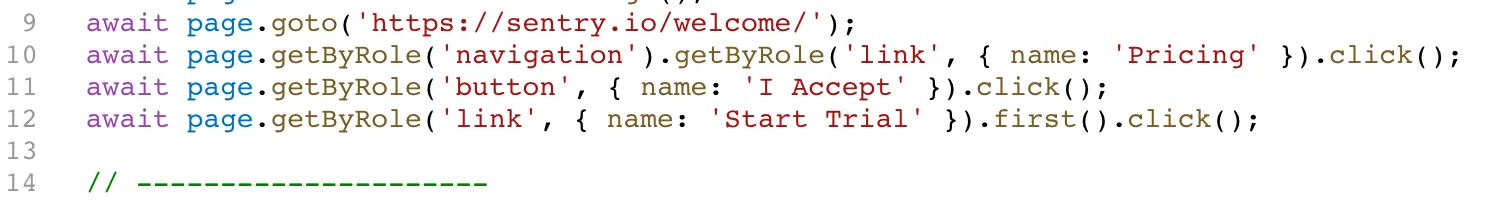
Create a new file (for example: myscenarios.mjs, note only ESM is supported right now) and export a class with a descriptive name that contains a run() method that has two parameters: browser and page and with the code that you copied from the Playwright generator as the method contents. You can export multiple classes if you have different states of your application (for example, an environment without Sentry, with Sentry, and with Sentry & Session Replay). Otherwise, if you are testing locally, you will need to re-run the benchmarking script after you update your local environment.
export class MyBaseScenario {
  async run(browser, page) {
    await page.goto("https://sentry.io/welcome/");
    await page.getByRole("navigation").getByRole("link", { name: "Pricing" }).click();
    await page.getByRole("button", { name: "I accept" }).click();
    await page.getByRole("link", { name: "Start Trial" }).click();
  }
}

export class StagingWithReplayScenario {
  async run(browser, page) {
    await page.goto("https://staging.sentry.io/welcome/");
    await page.getByRole("navigation").getByRole("link", { name: "Pricing" }).click();
    await page.getByRole("button", { name: "I accept" }).click();
    await page.getByRole("link", { name: "Start Trial" }).click();
  }
}
Re-run the benchmarking script but on your newly created scenario
npx @sentry-internal/web-benchmark -f myscenario.mjsIf you have multiple scenarios defined, you will see a combined table of the results, otherwise you will see output similar to an earlier terminal output screenshot.
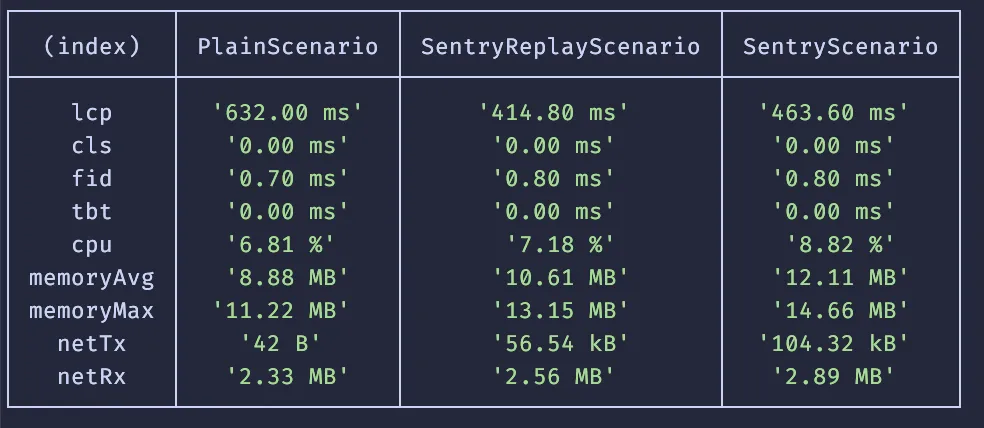
As you can see in the screenshot above with multiple scenarios, it is easy to see the baseline metrics for your application and how the Sentry SDKs affect them. We wanted to give you a tool that gives you actual numbers on your own application, instead of some hand-wavy words and we hope that this post helps accomplish that. If you have further questions, feel free to open an issue at https://github.com/getsentry/web-benchmark.