"Swizzling" iOS functions in Swift
SwiftUI view performance is often determined by the speed and frequency of calls to the body property. Third party performance monitoring frameworks, including Sentry, provide APIs to wrap a view’s body and report telemetry about its performance. However, there is no way to automatically get this data for every view in your app. With UIKit this could be easily accomplished by swizzling the UIView lifecycle, but in the world of pure Swift types this solution isn’t available. This post will look at the details of how the ViewPerformance Swift package solves this for debug builds, using the same technique I wrote about previously for generating order files.
Background
When you use Sentry to measure the performance of a UIKit app, every view controller and UIView will automatically be traced. Without any setup you can spot view controllers that are slow to load or to layout their views.
| UIKit automatic tracing |
This works using Objective-C swizzling, replacing the instance methods with stubs that add logging and then call the original method. This mechanism is possible because the Objective-C runtime uses selectors to identify methods and call them through objc_msgSend(). It would be very useful if we could do something similar for SwiftUI. For example, our snapshot test framework (from my work at Emerge Tools, now part of Sentry) could report the slowest views. However, Swift does not need to use this mechanism. Swift function calls can even be optimized away entirely by the compiler through inlining, so we can’t use swizzling to hook a pure Swift function.
In a previous post I showed how dyld interposing can be used to hook non-ObjC functions in a similar way to swizzling. However, this strategy has several limitations that won’t work for our use case - including that it requires knowing the function to hook at compile time.
To achieve “swizzling” for SwiftUI.View.body, we need to first identify all views and their body accessors at runtime, then install a hook on each function.
Finding Views
The Sentry Size Analysis includes a binary analysis that looks at type metadata emitted by the compiler to understand the sources of app size. This includes a record for every protocol conformance declared in your code. These conformance records are read by the Swift runtime for operations such as casting, something I previously did a deep dive on, demonstrating performance bottlenecks.
We can access the same protocol conformances used by the runtime in our own code, to identify which types conform to a specific protocol, in this case SwiftUI.View:
let header: mach_header_64 = ...

var size: UInt = 0
let sectStart = UnsafeRawPointer(
  getsectiondata(
    header,
    "__TEXT",
    "__swift5_proto",
    &size))?.assumingMemoryBound(to: Int32.self)
if var sectData = sectStart {
  for _ in 0..<Int(size)/MemoryLayout<Int32>.size {
    let conformanceRaw = UnsafeRawPointer(sectData)
      .advanced(by: Int(sectData.pointee))
    let conformance = conformanceRaw
      .assumingMemoryBound(to: ProtocolConformanceDescriptor.self)

    if "View" == protocolName(for: conformance) {
      let type = typeName(for: conformance)
      print("\(type) conforms to View")
    }
  }
}
In addition to the protocol and conforming type, the conformance descriptor includes a protocol witness table, the “proof” that the type conforms to the protocol. It contains pointers to all the functions the type must implement and the runtime uses it to dispatch a function call when the concrete type is not known at compile time. This is exactly the case in SwiftUI, when the OS frameworks will not know the type of your own code, just that it conforms to SwiftUI.View.
We can use the witness table to find the address of the View.body accessor. First we have to find which entry in the table corresponds to this function, that’s the job of the “method descriptor”. For this particular protocol conformance we need to look for the symbol named method descriptor for SwiftUI.View.body.getter : A.Body. Swift uses mangled symbol names, which we can lookup at runtime using dlsym:
let symbol = "$s7SwiftUI4ViewP4body4BodyQzvgTq"
let sym = dlsym(UnsafeMutableRawPointer(bitPattern: -2), symbol) // -2 == RTLD_DEFAULT
sym now points to the method descriptor we are looking for. The full layout of the protocol conformance descriptor can be complex, but all we need is the address of the implementation corresponding to this method descriptor. In the protocol descriptor these are stored right next to each other, we simply read in order every 4 bytes from the start of the protocol descriptor until we find the pointer to the method descriptor. The following 4 bytes contain the offset to the implementation. To summarize, we’ve parsed a protocol conformance descriptor like this:
| Conformance Descriptor | |
|---|---|
| Type Descriptor | MyApp.MyView |
| Protocol Descriptor | SwiftUI.View |
| Protocol Witness Table | |
$s7SwiftUI4ViewP4body4BodyQzvgTq | MyApp.MyView.body |
With the function addresses in hand, we’re ready to install our hooks.
Installing a hook
Now we’ve got the addresses of the functions we want to hook.1 We can use breakpoints to install a hook without swizzling (like we do to generate order files). At a high level we set a breakpoint on every function we want to hook, transferring control to a debugger when the function is entered. This was such a useful technique for the products that Emerge Tools made, that we open sourced a Swift package just for it: SimpleDebugger.
To insert a breakpoint you have to overwrite the instruction at the address with the brk instruction. This requires modifying the executable at runtime, which you can only do when the app is built for debugging. SimpleDebugger starts a mach exception handler which receives the break exception. Since LLDB also uses breakpoints, you must not start LLDB when using your own breakpoints.
So far this is all the same as generating order files, but unlike with order files where we only cared about the entry of a function, we now need to time the duration of the function. We’ll once again rely on our ability to set breakpoints and within the exception handler set a new breakpoint on the return address, which is saved in the link register. After setting the return breakpoint we single step past the entry breakpoint and wait until the return address breakpoint is hit - we then have the entire function duration.
I glossed over a lot of the low level details of using mach exceptions and setting breakpoints in favor of highlighting the core idea, but the interested reader can check out the source code.
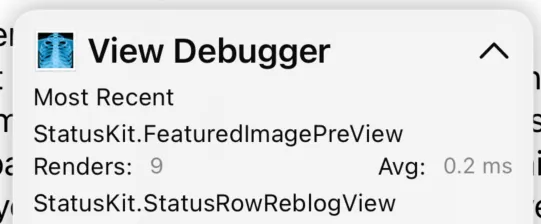 |
|---|
| The SDK tracking SwiftUI view performance |
In production
This cannot be used in production because it requires modifying the executable section of the binary, which Apple disallows unless you build with debug entitlements. However, there is another way to set a breakpoint. What we’ve used so far is known as a software breakpoint. There are also hardware breakpoints that do not overwrite instructions. Instead, they use reserved registers to indicate to the CPU which addresses should have a breakpoint. We verified this works on an app downloaded through TestFlight. However, unless the phone has “development mode” enabled, the calls to set these registers will silently fail. So production use would still be limited to a small subset of users.
Conclusion
We’ve explored a technique that brings Objective-C swizzling capabilities to pure Swift code by combining protocol conformance descriptors with software breakpoints. While it requires some low-level understanding of Swift’s runtime and assembly, the core idea is straightforward: find function addresses through protocol witness tables, then use breakpoints to intercept function entry and exit.
The ViewPerformance package is open source and ready to use in your debug builds today. It includes basic support for this idea, and can be easily modified to support your own use cases for tracking SwiftUI view performance in development. We’d love to see what use cases the community comes up with. If you have ideas or want to contribute, please open an issue or PR on the repository. And if you want to track view performance in production, check out the Sentry SDK.
Footnotes
-
Note that the current implementation does not support generic types that conform to
SwiftUI.View. These have more complex conformance descriptors that would require additional parsing. ↩