Tablecloth Trick: Migrating Issue Alerts to a New System
As a Sentry user or as a user of developer observability tools, you might be familiar with setting up an alert to get notified about certain things happening in your system.
In Sentry, we previously had at least 3 ways to set up an alert for issues (such as errors performance issues, metric alerts, crons, or uptime) and get notified about them. Each team responsible for a new issue type often ended up creating an entire alerting system just for their issue, when this should be a single system (issues are detected, and we alert on them).
The first part was to set up the abstraction for the singular system (known internally as workflow engine), but that’s deserving of its own blog post. This one will be about how we migrated the entire issue alerting pipeline into this new system without customers noticing.
The Great Migration
All of the information for an issue alert was previously stored in a JSON blob. The default issue alert looked like this in the UI…
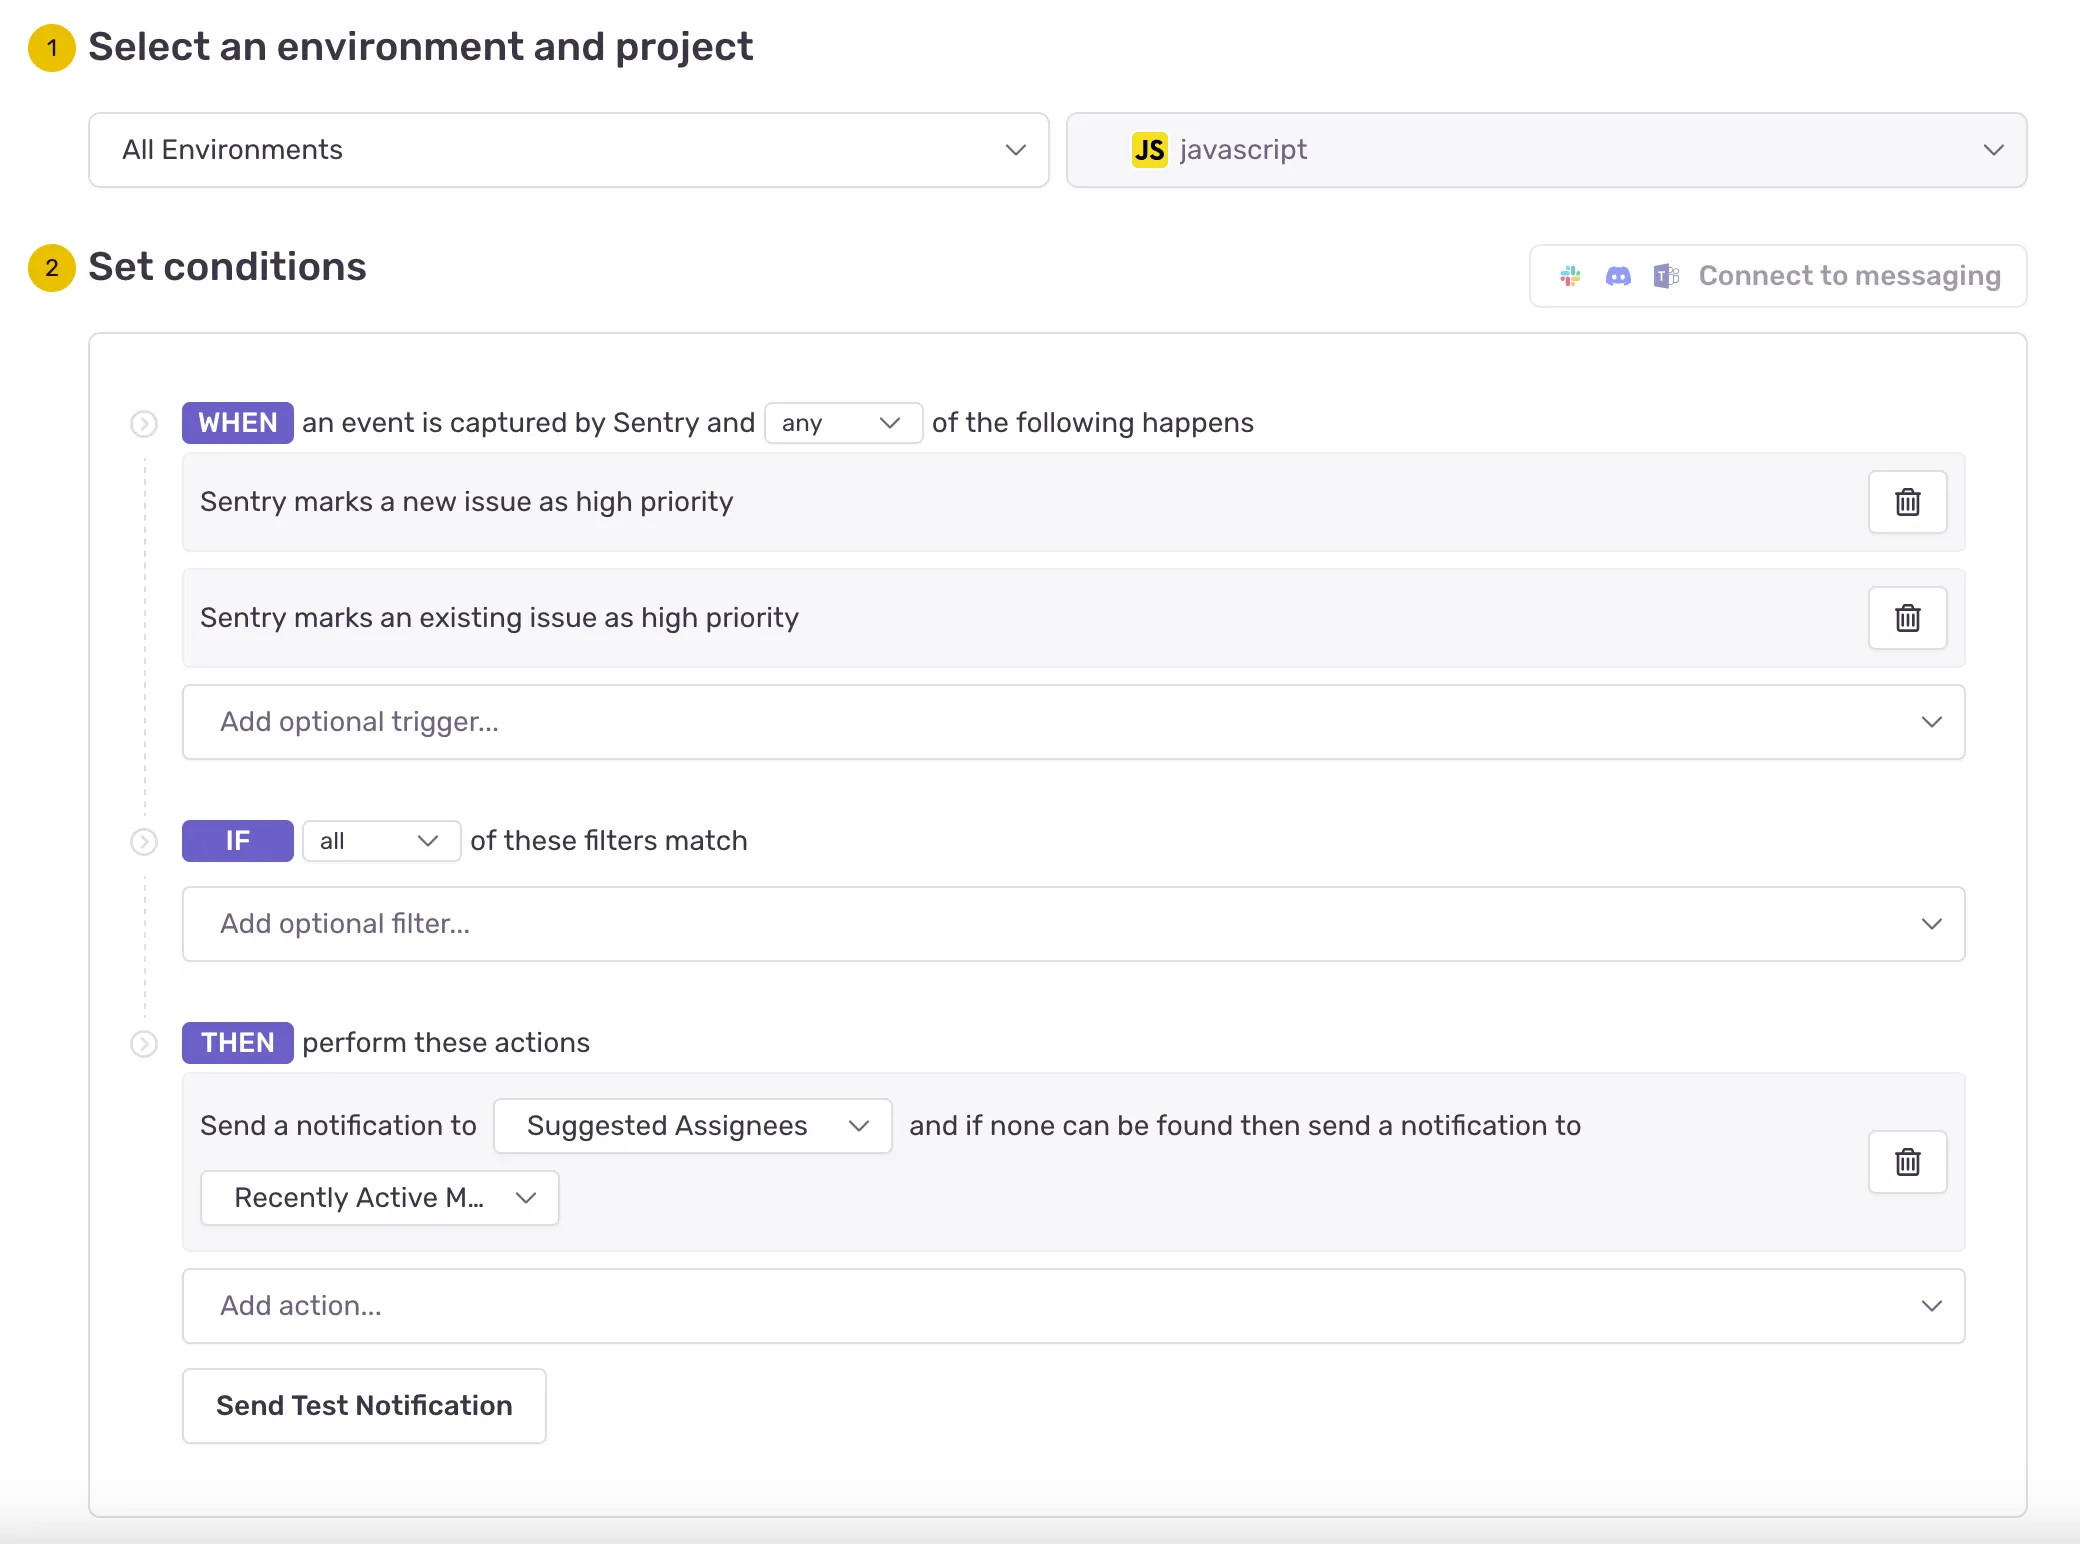
but the conditions and actions looked like this in the database! 👎
{
  "match":"all",
  "conditions":[
    {"id":"sentry.rules.conditions.first_seen_event.FirstSeenEventCondition"}
   ],
   "actions":[
     {
       "id":"sentry.mail.actions.NotifyEmailAction",
       "targetType":"IssueOwners",
       "targetIdentifier":null,
       "fallthroughType":"ActiveMembers",
       "uuid":"357c4bf7-86a4-4119-96f2-3b4a27a51831"
     }
  ]
}
We needed a way to normalize this data so we can use a single system to evaluate alerts for all issue types. If all of the different conditions and actions are shaped the same, they can be processed with the same logic. We moved each condition out into its own database row, each condition group into its own row, each alert action into its own row, etc. Each issue alert JSON blob was converted into a set of rows.
So the default issue alert now looks something like this in the DB:
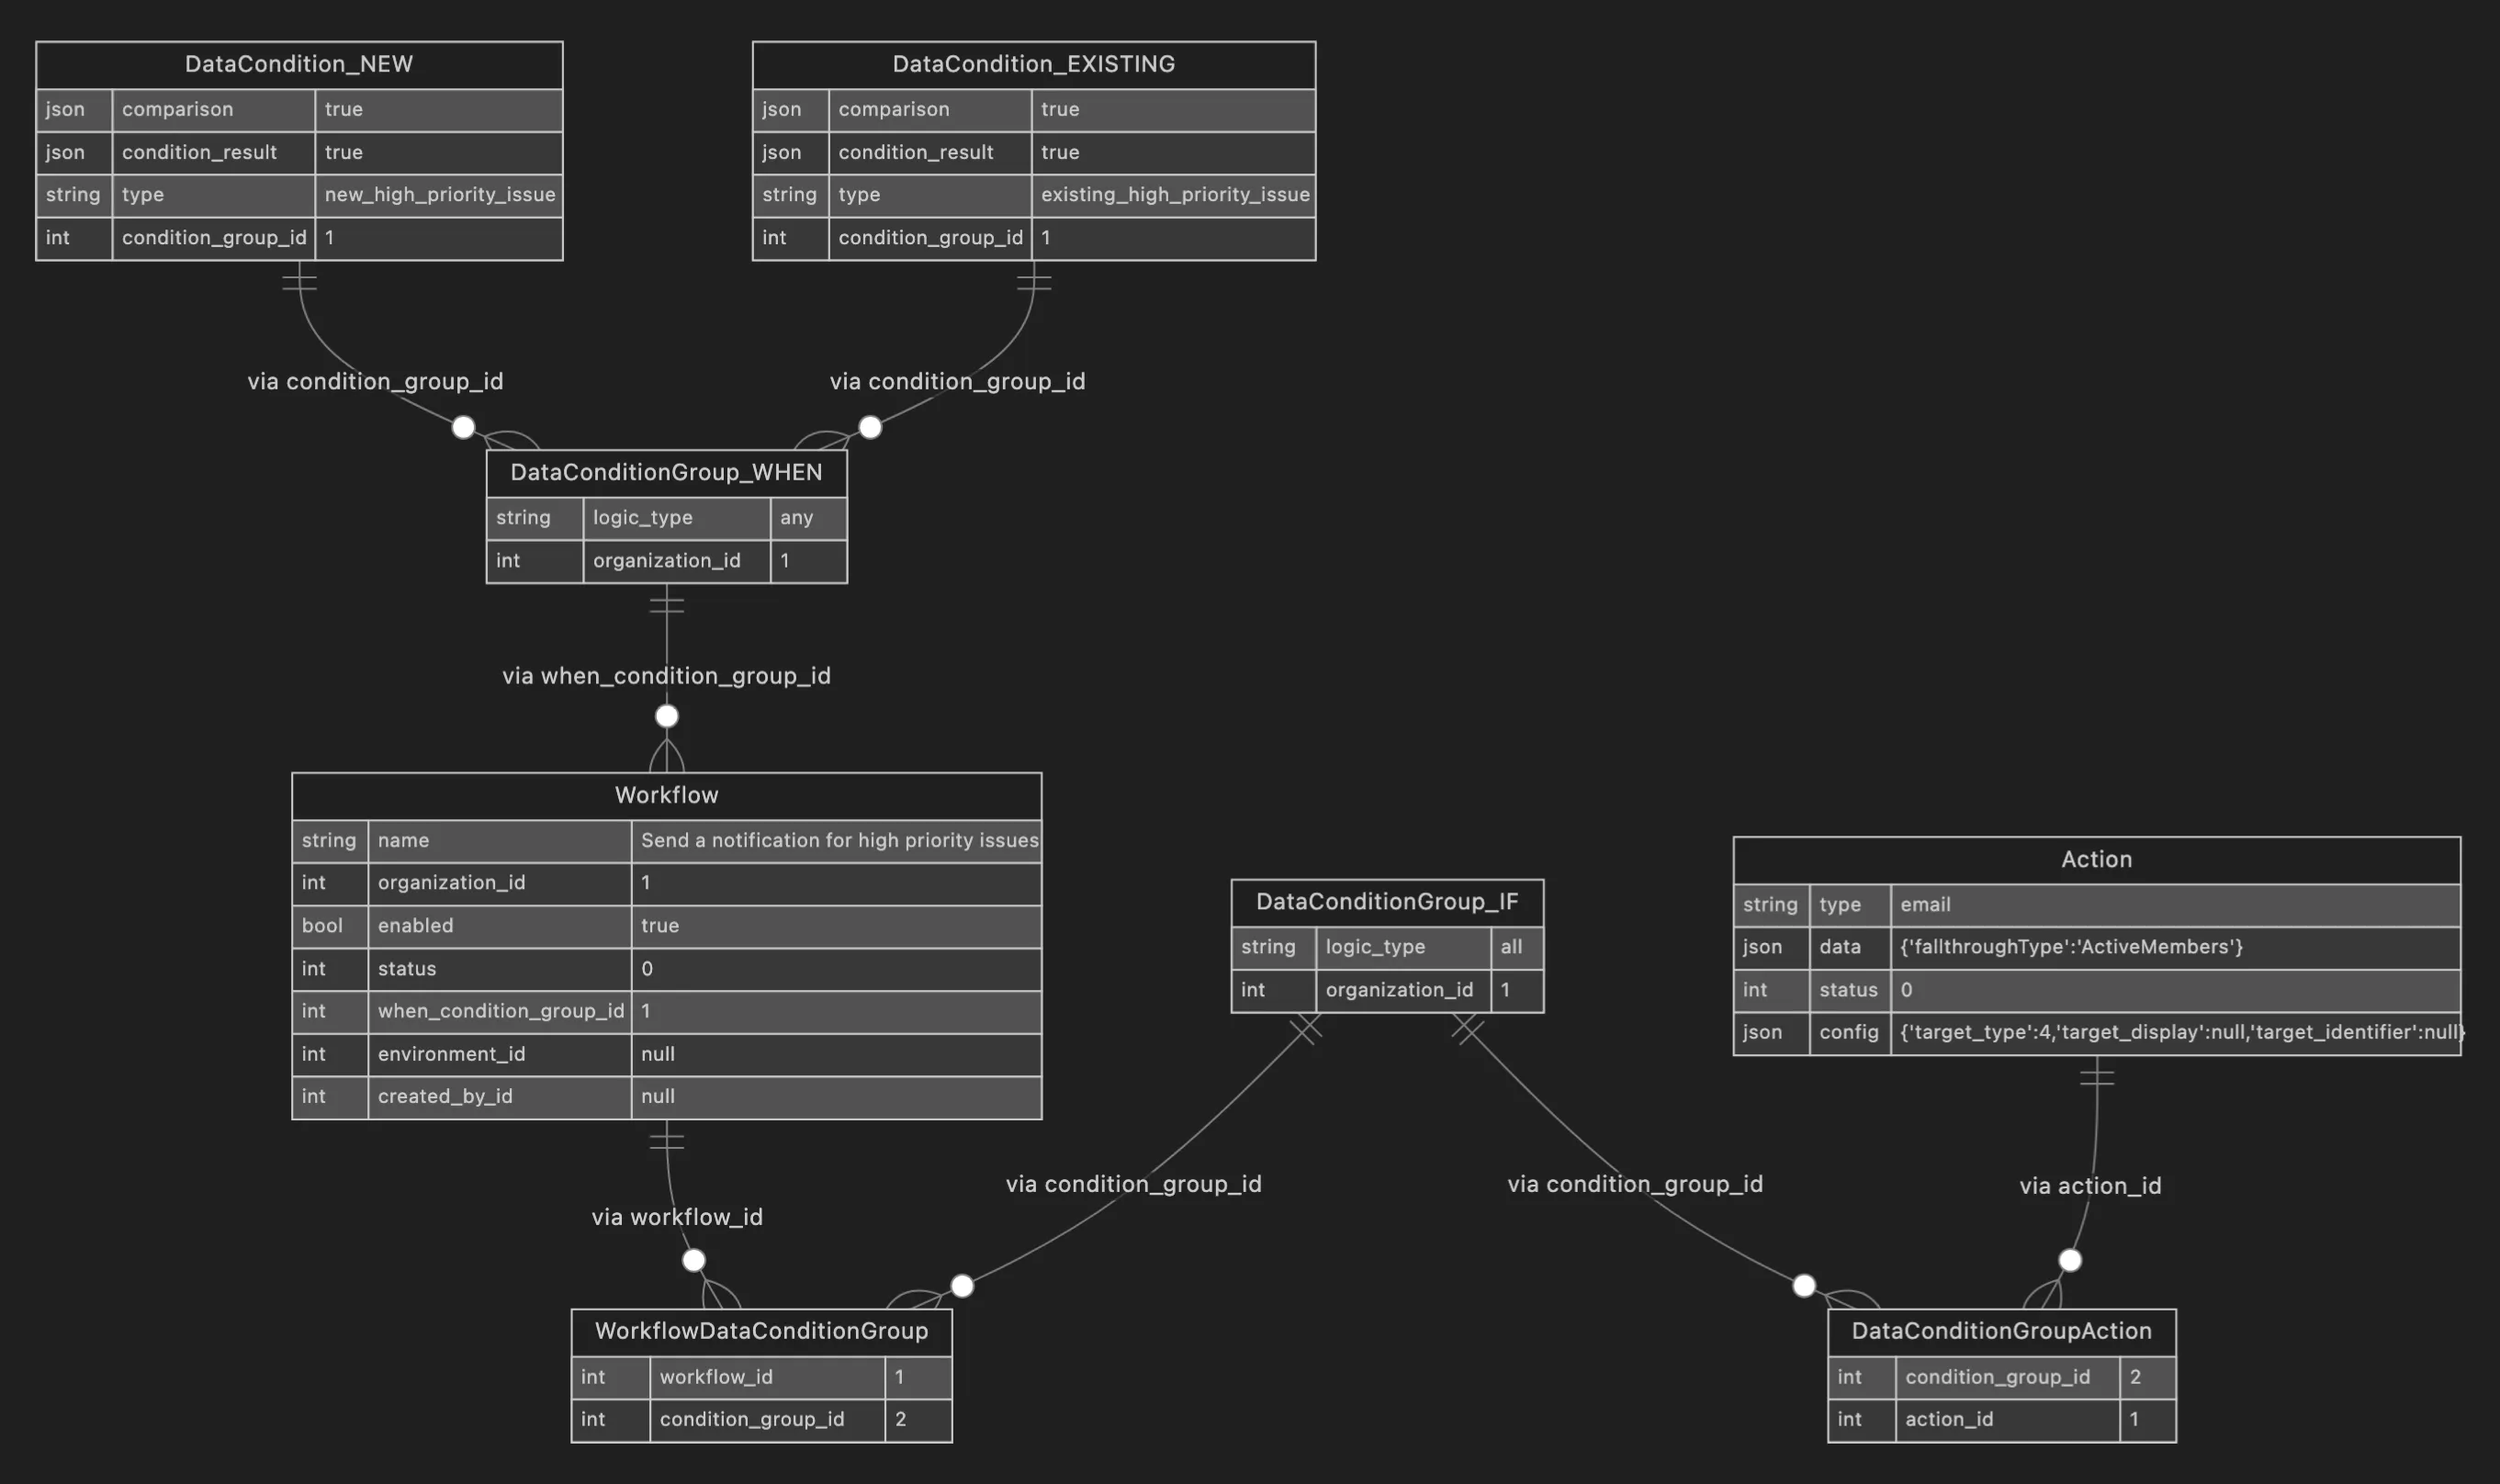
We migrated over 2 million issue alert blobs to over 20 million neat, queryable rows.
The Great Translation
Now that we had a bunch of polished rows, we needed to evaluate them in workflow engine the same way the old system did. This included rewriting all of the old condition processing logic, which includes processing fast and slow conditions.
The new and old processing flows look like this:
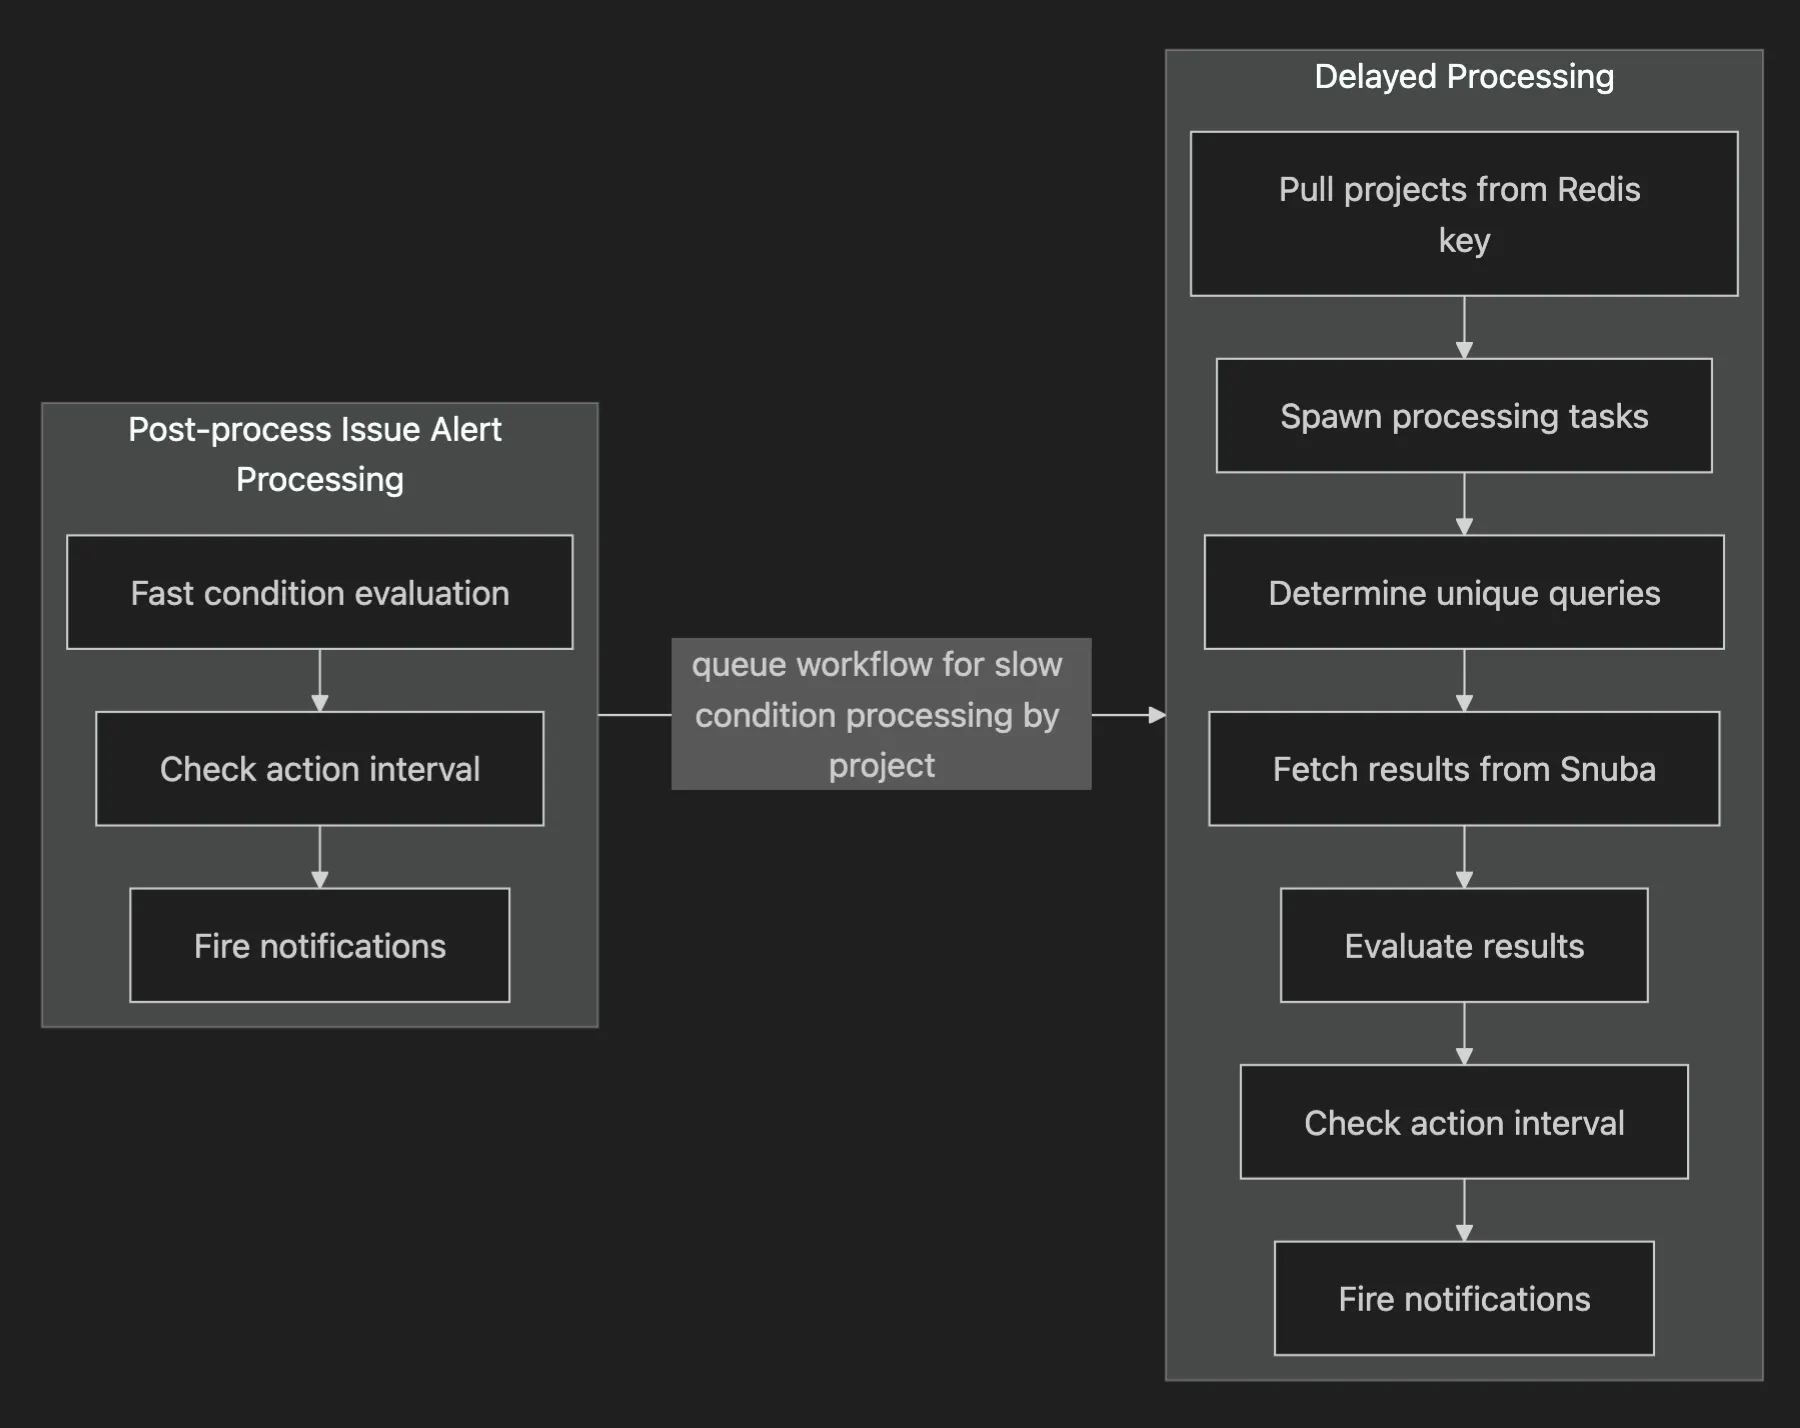
Fast conditions (like “Sentry marks a new issue as high priority”) can be processed immediately when we fetch the list of conditions, and slow conditions (like “an issue is seen more that 5 times in 1 min”) are queued for batched, delayed processing.
We took this opportunity to standardize and abstract as much as we could. For example, we cleaned up the condition handling logic by using a condition handler registry and a generic handler class with single method.
DataConditionResult = DetectorPriorityLevel | int | float | bool | None

class DataConditionHandler(Generic[T]):
    comparison_json_schema: ClassVar[dict[str, Any]] = {}
    condition_result_schema: ClassVar[dict[str, Any]] = {}

    @staticmethod
    def evaluate_value(value: T, comparison: Any) -> DataConditionResult:
        raise NotImplementedError
We also tried to share logic wherever possible — for instance, evaluating the WHEN block of conditions of the issue alert should be the same as evaluating the IF block of conditions, and we can have a single function to do that.
Slow conditions are queued because we have rate limiting in place for Snuba, Sentry’s data store for events. We completely rewrote our existing delayed processing logic to handle the new data and also made improvements to address previously buggy behavior, such as:
- Adding retries to the delayed processing task
- Handling incomplete data from Snuba (we retry, or if no more retries, continue with evaluation)
- Avoiding N+1 queries to Nodestore and Postgres
- Sharing logic with fast condition processing as much as possible
The Great Translation also involved an effort to make sure we could send notifications with the new Action rows to all of our providers (e.g. Slack, Pagerduty, GitHub, email, third-party integrations, plugins, and webhooks). This was also no small feat as we have to interface with the legacy notification system (for now), which involves translating the new data shapes back into what’s expected in the old system.
The Great Tablecloth Trick
We finally get to the title of this post! The tablecloth trick involved:
- Silently running the new workflow engine system alongside the old one and only firing notifications from the old system
- Solving performance issues and addressing an incident while scaling up the silent dual processing rollout
- Loudly running the new workflow engine system by sending error traffic through it and firing notifications
A wee incident
One day, as we were ramping up dual processing, the team awoke to reports that Sentry was super slow, and a portion of users couldn’t load the web app. We figured out that it was because we reproduced the logic from the old system too accurately. Both systems were writing to a single key, respectively, on a shared shard. During peak traffic, this overloaded the shard, which subsequently slowed down the Redis cluster that was also being used for bulk backend processing (memory, concurrent connections, number of keys were all spiking).
To fix this, we sharded the Redis keys that store the project ids for delayed processing to split them across multiple nodes, and we provisioned our own Redis cluster so our system backing up doesn’t affect the rest of Sentry.
Onward
Today, errors are fully run through the new system. We also have feature flags in place to allow for the other issue types to funnel through workflow engine when we are ready, and the accompanying UI changes will be available soon. Stay tuned!